

Unlocking Peak Website Performance: A Data-Driven Approach
Want a faster, more effective website? This listicle reveals 8 crucial website performance metrics you need to track in 2025. Understanding these metrics is key to optimizing user experience, boosting conversions, and achieving your business objectives. From page load time to interaction metrics like First Input Delay (FID) and Interaction to Next Paint (INP), we'll cover the essential data points for improving your site. Mastering these website performance metrics empowers you to create a seamless and engaging online experience, regardless of platform (WordPress, Shopify, Webflow, or custom).
1. Page Load Time
Page Load Time is a crucial website performance metric referring to the total time it takes for a webpage to fully load in a user's browser. This measurement begins when a user clicks a link or enters a URL and ends when all content—text, images, scripts, and stylesheets—is completely rendered and displayed. Page Load Time is a fundamental indicator of website performance, directly impacting user experience, bounce rates, and ultimately, conversion rates. A slow-loading website can frustrate users, leading them to abandon your site and potentially choose a competitor.
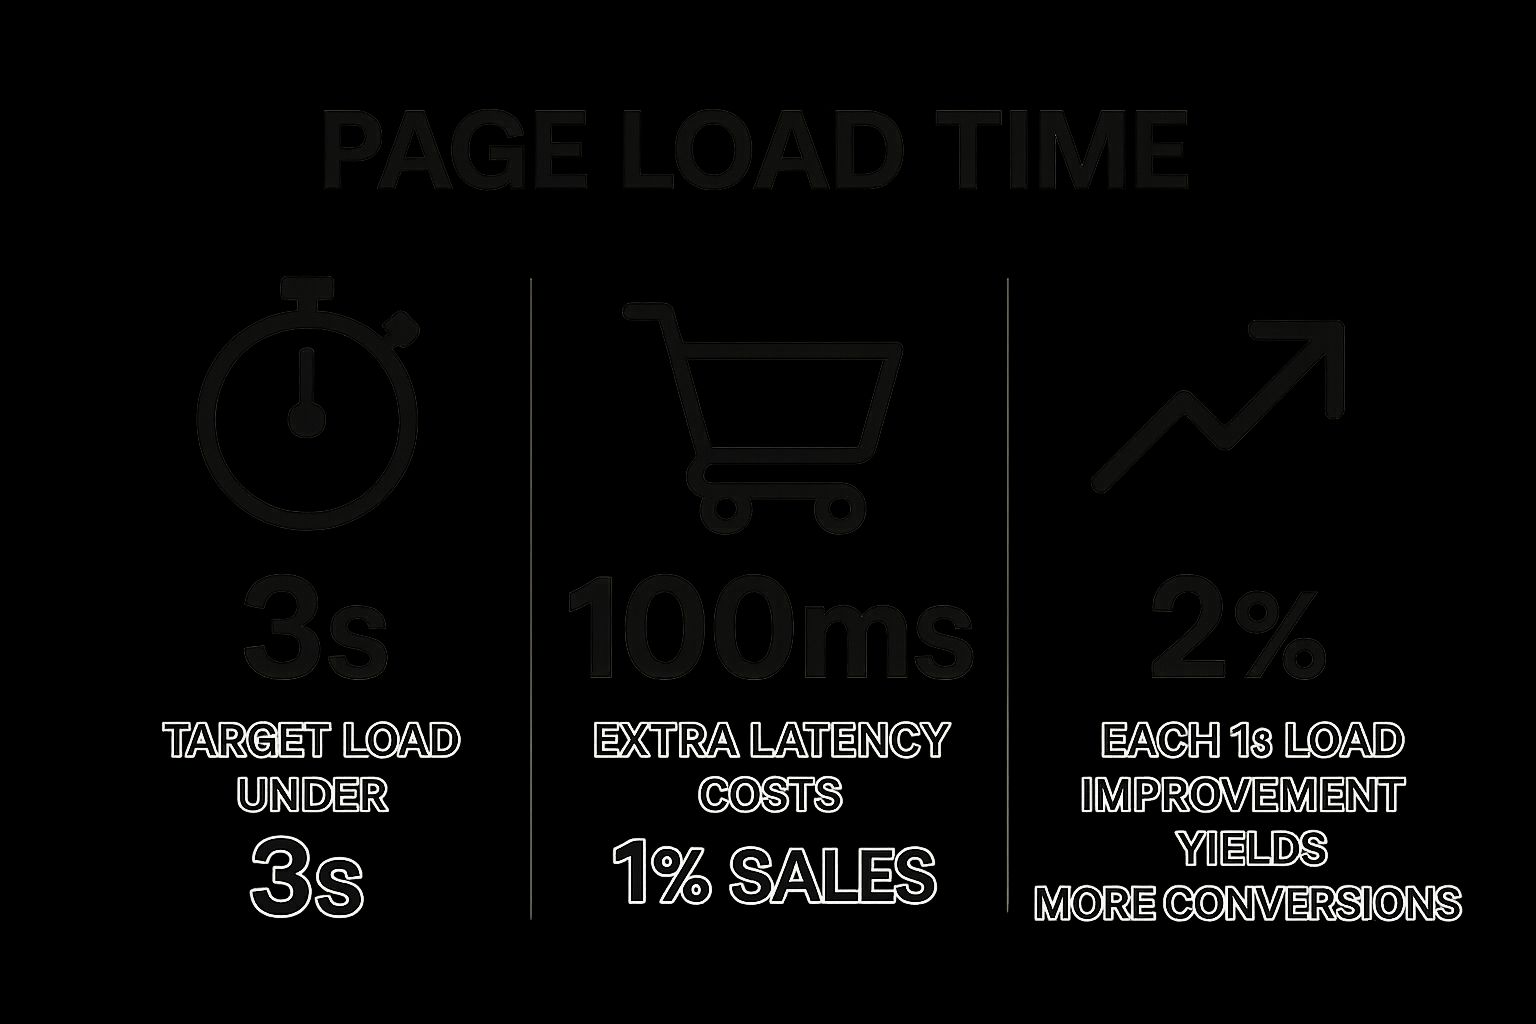
This infographic visually represents the impact of page load time on key business metrics. As illustrated, even small increases in load time can significantly impact bounce rate and conversion rates. For example, a page load time increase from 1 second to 3 seconds can increase bounce rate by 32% and decrease conversions by 7%. This highlights the importance of optimizing page load time for a positive user experience and business outcomes.
Page Load Time encompasses the entire loading process, from the initial request to the final render. This can be broken down into network time (the time it takes for the request to reach the server and the response to return), server response time (the time the server takes to process the request), and client-side rendering time (the time the browser takes to render the page content). This metric is typically measured in seconds or milliseconds and can vary based on factors such as device type, network conditions, and the user's browser. Understanding these contributing factors is critical for effective optimization. A critical aspect of understanding and improving website performance is regular testing. Running a website speed test can pinpoint bottlenecks and areas for improvement. As the CLDY article, Website Speed Test: A Practical Guide to Boosting Your Site Performance, explains, regular speed tests are essential for identifying areas that need attention.
Features and Benefits:
- Holistic View: Provides a complete overview of overall page performance.
- Easy to Understand: Simple metric for non-technical stakeholders to grasp.
- User-Centric: Directly correlates with user experience metrics like bounce rate.
- Widely Supported: Available in most analytics and performance monitoring tools.
Pros:
- Comprehensive measure of website speed.
- Easy to interpret and communicate.
- Strong correlation with user satisfaction.
- Readily available data through various tools.
Cons:
- Requires further analysis to pinpoint specific bottlenecks.
- Can be skewed by device type and connection speed variations.
- Influenced by third-party resources beyond your control.
- Doesn't account for perceived performance (how quickly the page appears to load).
Examples of Successful Implementation:
Industry giants like Amazon, Walmart, and Google have demonstrated the significant impact of optimizing Page Load Time. Amazon found that every 100ms of latency cost them 1% in sales. Walmart saw a 2% increase in conversions for every 1 second improvement in page load time. Google has used page speed as a ranking factor in search results since 2010 and made it even more critical with the introduction of Core Web Vitals.
Tips for Improving Page Load Time:
- Set Benchmarks: Aim for a Page Load Time under 3 seconds, a generally accepted industry standard.
- Test Across Devices and Networks: Ensure consistent performance across different devices and connection speeds.
- Utilize Performance Tools: Leverage tools like Google PageSpeed Insights, GTmetrix, or WebPageTest to analyze performance and identify areas for improvement.
- Implement Progressive Loading: Improve perceived performance by loading essential content first and non-essential content later.
Learn more about Page Load Time
Why Page Load Time Matters for Your Business:
For SMBs, entrepreneurs, marketers, and agency professionals, Page Load Time is a critical website performance metric. It directly impacts user experience, influencing bounce rates, conversion rates, and ultimately, your bottom line. Optimizing this metric is essential for attracting and retaining customers, improving search engine rankings, and achieving your business goals. Focusing on Page Load Time is not just a technical task; it's a strategic imperative for success in today's competitive digital landscape. Optimizing this crucial metric is a key component of a successful website performance strategy for any business.
2. Time to First Byte (TTFB)
Time to First Byte (TTFB) is a critical website performance metric that measures the time it takes for a user's browser to receive the first byte of data from your web server after making an HTTP request. Think of it like this: a user clicks a link, and TTFB is the time it takes for the server to start responding. It's a key indicator of your server's responsiveness and the overall efficiency of your backend infrastructure. For SMBs, entrepreneurs, marketers, and agency leaders, understanding and optimizing TTFB is crucial for improving website speed, user experience, and ultimately, your bottom line.
How it Works:
TTFB encompasses several steps in the request-response cycle:
- DNS Lookup: The browser resolves your domain name (e.g., www.example.com) to an IP address.
- TCP Connection: The browser establishes a connection with the server.
- TLS Negotiation (if HTTPS): If your site uses HTTPS, the browser and server negotiate a secure connection.
- Server Processing: Your server processes the request, fetches necessary data (from databases, APIs, etc.), and prepares the response.
- First Byte Sent: The server sends the first byte of the response back to the browser.
TTFB is measured in milliseconds (ms) and includes all the time spent on these steps. It's important to note that TTFB is independent of the overall page size or complexity; it only measures the time to receive that initial byte.
Why TTFB Matters in Website Performance Metrics:
TTFB deserves a prominent place on any list of essential website performance metrics because it directly impacts user experience and SEO. A slow TTFB leads to a sluggish website, frustrating users and potentially driving them away before your content even loads. Search engines like Google also consider TTFB in their ranking algorithms, meaning a slow TTFB can negatively affect your search visibility. For CEOs, CMOs, and Heads of Marketing, this translates to lost potential customers and reduced online success.
Features and Benefits:
- Isolates Backend Performance: TTFB isolates server and network issues from frontend problems, allowing you to pinpoint bottlenecks in your backend infrastructure.
- Identifies Bottlenecks: A high TTFB can indicate issues with database queries, slow server-side code, inefficient caching, or problems with your hosting provider.
- SEO Impact: Google uses TTFB as a ranking factor, so optimizing it can improve your search rankings.
- Hosting & CDN Effectiveness: TTFB provides valuable insight into the quality of your web hosting and the effectiveness of your Content Delivery Network (CDN).
Pros and Cons:
Pros:
- Pinpoints server and network performance issues
- Critical for SEO
- Provides insight into hosting and CDN effectiveness
Cons:
- Doesn't reflect the full user experience (just the initial response)
- Can be affected by external factors (user's ISP, location)
- Improvements might require infrastructure changes
- Not directly visible to end-users
Examples of Successful Implementation:
- BBC: By implementing edge caching, the BBC significantly reduced their TTFB, improving user experience for their global audience.
- Financial Times: Optimizing their API architecture resulted in a 50% decrease in TTFB and improved Core Web Vitals scores.
- Netflix: Their Open Connect CDN optimizes TTFB to deliver content efficiently to millions of users worldwide.
Actionable Tips for Improvement:
- Implement Server-Side Caching: Caching frequently accessed data reduces server load and improves TTFB.
- Optimize Database Queries and Application Code: Identify and fix slow database queries and inefficient code in your backend applications.
- Utilize a CDN: A CDN distributes your content closer to users, reducing network latency and improving TTFB.
- Configure HTTP Caching Headers: Proper caching headers tell browsers how long to store assets locally, reducing requests to your server.
- Consider Serverless Architecture or Edge Computing: These technologies can significantly improve TTFB for critical endpoints by processing requests closer to the user.
When and Why to Use this Approach:
TTFB optimization should be a priority for any website owner or business looking to improve website speed, user experience, and search rankings. If you're experiencing slow page load times or your website feels sluggish, investigating and improving your TTFB is a crucial first step.
Popularized By:
- Google's Web Performance Working Group
- Akamai
- Ilya Grigorik
- HTTP Archive
3. First Contentful Paint (FCP)
First Contentful Paint (FCP) is a crucial website performance metric that measures how long it takes for a user to see any content on your webpage after they begin navigating to it. This "content" could be anything visible: text, an image, a non-white canvas element, or an SVG. FCP is a critical component of Google's Core Web Vitals, a set of metrics that Google uses to assess the user experience of a website. By focusing on this initial rendering speed, FCP provides valuable insights into how quickly users perceive your page as loading and displaying something meaningful. This directly impacts user engagement and, subsequently, your SEO.

FCP deserves its place on the list of essential website performance metrics because it provides a strong indicator of perceived loading speed. For users, seeing something appear on the screen quickly confirms that the page is actually loading, mitigating bounce rates and improving the overall user experience. This initial impression is vital for businesses, entrepreneurs, marketers, and agencies alike, as it directly influences user engagement, conversion rates, and ultimately, business success.
Features and Benefits:
- Marks initial content render: Pinpoints the moment users see something, providing insight into perceived performance.
- Core Web Vital: Directly impacts your website's SEO performance, as Google uses FCP as a ranking factor.
- Measured in seconds: Offers a quantifiable measure for tracking progress and setting performance goals.
- Focuses on initial rendering: Prioritizes the first impression, which is critical for user engagement.
Pros:
- User-centric perspective: Reflects the user's initial experience and perceived loading speed.
- Identifies render-blocking resources: Helps pinpoint bottlenecks that delay content display.
- Correlates with user engagement: A faster FCP generally leads to improved user engagement metrics.
- Direct SEO impact: A good FCP score contributes to better search engine rankings.
Cons:
- Doesn't prioritize important content: Measures any content, not necessarily the most relevant information for the user.
- Can be misleading: A small, insignificant element loading quickly can give a falsely positive FCP score.
- Limited scope: Doesn't account for interactivity or complete visual rendering.
- May not reflect full user experience: Critical content loading later can still negatively impact the overall experience.
Examples of Successful Implementation:
- The Guardian: Improved FCP by a remarkable 89% by optimizing font loading and removing render-blocking resources.
- Pinterest: Achieved a 30% reduction in FCP through code splitting and critical CSS inlining.
- Shopify: Saw increased conversion rates for merchants directly attributed to storefront improvements impacting FCP.
Actionable Tips for Improving FCP:
- Eliminate render-blocking resources: Defer or asynchronously load JavaScript and CSS that prevent initial content rendering.
- Implement critical CSS inlining: Include the CSS necessary for above-the-fold content directly in the HTML.
- Optimize web font loading: Use
font-display: swapto allow the browser to display fallback fonts while custom fonts load. - Use server-side rendering or pre-rendering: Generate HTML on the server to deliver content faster to the browser.
- Leverage browser caching: Allow returning visitors to load assets faster from their local cache.
When and Why to Use This Approach:
FCP optimization is crucial for any website aiming to improve user experience, engagement, and SEO. It's particularly important for businesses, e-commerce sites, and content-heavy websites where quick loading times are essential for capturing user attention and driving conversions. By focusing on FCP, you're prioritizing the first impression your website makes, creating a more positive and engaging experience for your users. This directly translates to improved bounce rates, longer session durations, and higher conversion rates, ultimately contributing to the success of your online presence. While there isn't a specific website link for FCP itself, you can learn more through Google's Web.dev resources on Core Web Vitals. FCP was popularized by the Google Chrome team, Lighthouse (Google's automated web performance tool), the Chrome User Experience Report (CrUX), and the Web Vitals initiative by Google.
4. Largest Contentful Paint (LCP)
Largest Contentful Paint (LCP) is a crucial website performance metric that measures how quickly the largest content element within the user's viewport becomes visible. Think of it as timing how long it takes for the most dominant piece of content – often a hero image, a large block of text, or a video – to appear on the screen. LCP is a key component of Google's Core Web Vitals, a set of metrics that Google uses to evaluate user experience and, importantly, influence search rankings. For SMBs, entrepreneurs, marketers, agency professionals, and business leaders alike, understanding and optimizing LCP is essential for attracting and retaining customers in today's competitive digital landscape.
How LCP Works
LCP focuses solely on the render time of the largest visible content element, which could be an image, video, or a large block-level text element. The metric updates dynamically as the page loads. If a larger element appears later in the loading process, the LCP value will adjust accordingly. This measurement, captured in seconds, provides a valuable snapshot of how quickly users can perceive the main content of your page. It directly correlates with perceived page load speed, which can significantly impact user engagement, bounce rates, and ultimately, conversions.
Why LCP Matters for Your Business
LCP's prominence as a Core Web Vital underscores its significance. Google uses LCP as a ranking factor, meaning a faster LCP can contribute to higher search result positions, driving more organic traffic to your website. Beyond SEO, a good LCP contributes directly to a better user experience. A quickly loading page keeps users engaged, reducing bounce rates and encouraging them to explore your site further, ultimately impacting conversions and revenue.
Pros and Cons of using LCP
-
Pros:
- User-centric: More accurately reflects the user's loading experience than older metrics.
- Content Focused: Directly correlates with how quickly users can engage with the primary content.
- SEO Benefit: Significant ranking factor for Google search results.
- Identifies Bottlenecks: Helps pinpoint specific large elements that require optimization.
-
Cons:
- Subjectivity: May not always identify what every user considers the most important content.
- Volatility: Can fluctuate on pages where content size changes dynamically.
- Complexity: Element identification can be challenging in complex layouts.
- Scope: Doesn't account for overall interactivity or layout stability (other Core Web Vitals address these).
Examples of Successful LCP Optimization
Real-world examples demonstrate the tangible benefits of focusing on LCP:
- Vodafone: Improved their LCP by 31% through lazy loading and critical rendering path optimization, resulting in an 8% increase in conversions.
- Wikimedia Foundation: Optimized image delivery and achieved a 30% improvement in LCP, leading to decreased bounce rates.
- Agrofy: Reduced LCP from 2.9 seconds to 1.5 seconds by implementing better image optimization and server-side rendering, leading to an increase in pages per session.
Actionable Tips for Improving LCP
- Optimize Images: Properly size and compress hero images and other large media assets.
- Responsive Images: Implement
srcsetandsizesattributes to serve appropriately sized images to different devices. - Preload Critical Resources: Use
<link rel="preload">for hero images and other essential resources. - Defer Non-Critical Scripts: Remove unnecessary third-party scripts or defer their loading to improve initial load time.
- Modern Image Formats: Use WebP or AVIF for better compression and quality.
- Server-Side Rendering (SSR): Consider SSR for faster content delivery, especially for dynamic content.
Key Figures & Resources:
LCP has been championed by the Google Chrome team, the Web Performance Working Group, Philip Walton (a Google Engineer instrumental in developing Core Web Vitals), and Annie Sullivan (Google Chrome team, key developer of performance metrics). More information can be found on Web.dev and specifically at web.dev/vitals.
By prioritizing LCP, businesses can improve website performance, enhance user experience, boost search rankings, and ultimately, achieve better business outcomes. This metric is a critical component of any comprehensive website optimization strategy.
5. Cumulative Layout Shift (CLS)
Cumulative Layout Shift (CLS) is a crucial website performance metric that measures visual stability. It quantifies how much elements move around unexpectedly as a page loads. Imagine trying to click a button, only to have it shift at the last second – frustrating, right? CLS measures that frustration, providing a score that reflects how disruptive the loading experience is for your users. This metric is part of Google's Core Web Vitals, meaning it directly impacts your search engine ranking.

CLS focuses on the visual stability of your page, not just its loading speed. It’s scored on a scale of 0 to 1, where 0 represents no unexpected shifts and higher scores indicate more movement. The score is calculated by multiplying the impact fraction (how much of the viewport was affected by the shift) by the distance fraction (how far the affected elements moved). CLS accumulates all unexpected layout shifts that occur throughout the entire page lifecycle, but importantly, it only counts shifts not initiated by user interaction.
Why CLS Matters for Your Business:
For SMBs, entrepreneurs, marketers, and agency professionals, a good CLS score translates directly to a better user experience. A stable page encourages engagement, reduces frustration, and can lead to higher conversion rates. Because CLS is a Core Web Vital, it also influences your SEO performance, affecting your visibility in search results. Ignoring CLS could mean losing potential customers to competitors with more stable and user-friendly websites.
Features and Benefits:
- Directly Correlates with User Frustration: A low CLS score ensures users can interact with your page without elements jumping around unexpectedly.
- Identifies Specific UI Stability Issues: CLS helps pinpoint the causes of layout shifts, which other metrics might miss.
- Impacts SEO: As a Core Web Vital, CLS directly affects your search ranking.
- Encourages Better Page Architecture and Resource Loading: Addressing CLS often leads to improved overall website performance.
Pros and Cons:
- Pros: Directly correlates with user frustration, identifies specific UI stability issues, impacts SEO, encourages better page architecture.
- Cons: Can be difficult to debug without specialized tools, may require significant layout restructuring, some shifts may be acceptable in certain UIs, less intuitive than timing metrics.
Examples of Successful Implementation:
- The Washington Post: Reduced CLS by 50% by implementing proper image dimensions and reserved space for ads, leading to a 28% longer session duration.
- Vodafone: Decreased CLS from 0.25 to 0.07 by setting explicit dimensions for embedded content, increasing conversion rates by 6%.
- YAHOO! JAPAN: Improved CLS by avoiding layout shifts from font loading, resulting in 15% lower bounce rates.
Actionable Tips for Improving CLS:
- Images and Videos: Always include
widthandheightattributes on images and video elements. - Reserved Space: Reserve space for ads, embeds, and iframes in your CSS.
- Content Insertion: Avoid inserting content above existing content unless in response to user interaction.
- Animations: Use
transformanimations instead of animations that trigger layout changes. - Fonts: Preload custom fonts and use
font-display: optionalorfont-display: swap. - Dynamic Content: Implement content placeholders or skeletons for dynamic content.
By focusing on CLS, you can create a smoother, more enjoyable user experience, ultimately leading to increased engagement, higher conversions, and improved search engine visibility. This makes CLS a vital metric for any business looking to succeed online.
6. First Input Delay (FID)
First Input Delay (FID) is a crucial website performance metric, especially for businesses focused on user experience and conversion. It measures the time from when a user first interacts with your page (like clicking a button, tapping a link, or using a dropdown) to the moment the browser can actually respond to that interaction. Think of it as the delay between a user's action and the website's reaction. This metric focuses specifically on the responsiveness of a page during loading, making it essential for pages where immediate interactivity is key. As a former Core Web Vital (being replaced by Interaction to Next Paint – INP – in 2024), FID helps quantify the user experience when interacting with a page that might feel unresponsive. Understanding and optimizing FID can significantly impact user satisfaction and ultimately, your bottom line.
For SMBs, entrepreneurs, marketers, and agency professionals, FID highlights a critical aspect of user experience that often gets overlooked. A slow FID can lead to frustration, bounces, and lost conversions. Imagine a potential customer trying to add an item to their cart, but the button doesn't respond immediately. They might assume the site is broken, abandon their purchase, and head to a competitor. CEOs, CMOs, and Heads of Marketing should pay close attention to FID as it directly reflects how users perceive their brand's online presence.
How FID Works:
FID focuses on the "main thread" of a browser, which is responsible for handling user interactions. If the main thread is busy processing other tasks (often lengthy JavaScript execution), it can't immediately respond to user input, leading to a delay. FID only measures this delay, not the time it takes to process the interaction once the browser is free. This distinction is important because it isolates the initial frustration a user experiences when a page feels unresponsive. It specifically captures the first user interaction, highlighting the initial impression of your website’s responsiveness.
Features and Benefits:
- Measures Real User Interactions: Unlike some metrics that rely on simulated interactions, FID captures actual user behavior, providing a more accurate representation of real-world experience.
- Focuses on Main Thread Blocking: FID pinpoints issues related to JavaScript execution that often bog down the main thread and delay input responsiveness.
- Directly Impacts User Experience: A low FID translates to a smoother, more responsive user experience, increasing user satisfaction and engagement.
Pros:
- Reflects Real User Frustration: FID accurately captures the annoyance users feel when a page is unresponsive.
- Identifies JavaScript Issues: It helps pinpoint JavaScript execution problems that might be missed by other performance metrics.
- Impacts User Trust and Engagement: A responsive website fosters trust and encourages users to interact more.
- Formerly a Google Ranking Factor: As a former Core Web Vital, FID played a role in Google's page experience ranking signals, influencing search visibility.
Cons:
- Only Measures the First Interaction: FID doesn't capture potential responsiveness issues that may occur after the initial interaction.
- Requires Real User Data: Accurate FID measurement requires real user data, as it can't be fully simulated in lab environments.
- Doesn't Measure Processing Time: It only measures the delay, not the time it takes to fully process the user interaction.
- Being Replaced by INP: While still valuable, FID is being replaced by Interaction to Next Paint (INP) as a Core Web Vital in 2024.
Examples of Successful FID Optimization:
- MakeMyTrip: By optimizing JavaScript execution, MakeMyTrip improved FID from 272ms to 53ms, leading to a 4% increase in conversion rates.
- BBC: Through code splitting and deferring non-critical JavaScript, the BBC reduced FID by 80%, boosting page engagement.
- Zalando: JavaScript optimization techniques helped Zalando improve FID, resulting in 13% lower bounce rates.
Tips for Improving FID:
- Break Up Long Tasks: Split lengthy JavaScript tasks into smaller, asynchronous tasks to prevent main thread blockage.
- Minimize/Defer JavaScript: Reduce or defer the execution of JavaScript that isn't essential for initial user interactions.
- Remove Unused Code: Eliminate unused JavaScript and CSS to reduce parsing and compilation time.
- Use Web Workers: Offload complex calculations to web workers, freeing up the main thread to handle user input.
- Progressive Hydration: For JavaScript frameworks, implement progressive hydration to prioritize rendering and interactivity.
- Optimize Event Handlers: Ensure event handlers are lightweight and efficient to minimize their impact on the main thread.
Learn more about First Input Delay (FID)
While FID is being replaced by INP, optimizing for responsiveness remains crucial. By understanding and addressing FID, businesses can create a smoother, more engaging user experience that drives conversions and strengthens their online presence. Understanding these website performance metrics is essential for any online business.
7. Interaction to Next Paint (INP)
Interaction to Next Paint (INP) is a crucial website performance metric that measures how quickly your page responds to user interactions like clicks, taps, and keyboard inputs. Unlike its predecessor, First Input Delay (FID), which only measures the delay of the first interaction, INP considers all interactions throughout a user's visit. It then reports a single value representing the worst interaction response time, or a high percentile (typically 75th), giving you a more comprehensive understanding of your website's overall responsiveness. This is particularly important because a sluggish website can lead to frustrated users and ultimately impact your bottom line. INP is slated to replace FID as a Core Web Vital in March 2024, making it a critical metric for website owners to understand and optimize.
How INP Works:
INP measures the time from when a user interacts with your page (e.g., clicks a button) to when the browser paints the next frame on the screen. This duration includes the input delay (the time it takes for the browser to respond to the input), the processing time (the time it takes to execute any JavaScript related to the interaction), and the presentation delay (the time it takes to actually update the visuals on the screen). A lower INP signifies a more responsive website.
Why INP Matters:
INP deserves a spot on this list because it provides a more realistic and complete picture of user experience compared to previous interactivity metrics. A slow initial interaction (measured by FID) might be forgivable, but consistently slow responses throughout the user journey can be incredibly frustrating. Optimizing for INP ensures a smoother, more enjoyable experience for your users, leading to increased engagement, higher conversion rates, and improved customer satisfaction.
Features and Benefits:
- Comprehensive Responsiveness Measurement: Captures responsiveness throughout the page lifecycle, not just the first interaction.
- Realistic User Experience Reflection: Better reflects the full user experience by considering all interactions.
- Holistic Optimization: Encourages optimization of all interactive elements on the page.
- Includes all Delay Factors: Accounts for input delay, processing time, and presentation delay.
Pros and Cons:
Pros:
- More comprehensive than FID for measuring overall page responsiveness.
- Better reflects the full user experience beyond initial page load.
- Encourages optimization of all interactive elements, not just initial ones.
- Accounts for both event handling time and visual response time.
Cons:
- Relatively new metric with evolving best practices.
- More complex to optimize for than FID.
- May require significant JavaScript architecture changes to improve.
- Limited historical data compared to established metrics.
Examples of Successful Implementation:
- Mercado Libre: Improved INP by 30% by optimizing event delegation and rendering, resulting in increased user session time.
- Etsy: Optimized search filter interaction response times, improving INP and seeing a 12% increase in filter usage.
- Booking.com: Improved INP on hotel selection pages by optimizing JavaScript execution, leading to higher conversion rates.
Actionable Tips for Improving INP:
- Use Event Delegation: Reduce the number of event listeners attached to individual elements.
- Free Up the Main Thread: Minimize long-running tasks on the main thread during user interactions.
- Utilize
requestAnimationFrame: Optimize visual updates to align with the browser's rendering cycle. - Break Down Complex Tasks: Split complex event handlers into smaller, asynchronous tasks.
- Leverage CSS Animations: Use CSS for animations whenever possible instead of JavaScript.
- Debounce/Throttle Frequent Events: Implement debouncing or throttling for events like scrolling or resizing.
- Test on Mid-Tier Devices: Test interactive elements on a range of devices, including mid-tier mobile phones, not just high-end ones.
When and Why to Use INP:
You should always monitor and strive to improve INP. It's a critical metric for understanding and optimizing the overall responsiveness of your website. This is particularly crucial for businesses and websites that rely heavily on user interaction, such as e-commerce sites, web applications, and interactive content platforms. By optimizing INP, you can significantly enhance the user experience and drive key business outcomes. The importance of INP is further underscored by its upcoming inclusion as a Core Web Vital.
(While a dedicated website for INP doesn't exist, further information can be found on web.dev and the Chrome Developer blog by searching for "Interaction to Next Paint".) These resources, often authored by Google performance engineers like Philip Walton and Annie Sullivan, offer invaluable insights and best practices. They are excellent resources for staying up-to-date on the latest developments related to INP and other Core Web Vitals.
8. Total Blocking Time (TBT)
Total Blocking Time (TBT) is a crucial website performance metric that measures how long a page takes to become fully interactive. For SMBs, entrepreneurs, marketers, and agency leaders, understanding and optimizing TBT can significantly impact user experience, conversion rates, and ultimately, your bottom line. It quantifies the total time the main thread of a user's browser is blocked during the initial page load, preventing them from interacting with the page, such as clicking buttons, scrolling, or entering text. Imagine a user landing on your website, eager to explore, only to find the page unresponsive. A high TBT contributes to that frustrating experience, potentially leading to lost customers and revenue.
How does TBT work? Between the time the first content paints on the screen (First Contentful Paint or FCP) and the point the page becomes fully interactive (Time to Interactive or TTI), long tasks might occur. Any task taking longer than 50ms is considered "long" and its "blocking portion" (the time beyond 50ms) is added to the TBT. Essentially, TBT sums up all these blocking portions, providing a total measure of how much time the user is prevented from interacting with the page during this critical loading phase.
Why does TBT deserve a place on this list of key performance metrics? Because it directly relates to how users perceive your website's responsiveness. While page load time is important, a page might appear loaded but still be unresponsive if the main thread is busy executing long tasks. TBT helps pinpoint this issue, focusing on the interactive aspect of performance. It's a valuable lab metric that strongly correlates with First Input Delay (FID), a field metric measuring a real user's first interaction with the page. By optimizing TBT in a lab setting, you can effectively improve the real-world user experience reflected by FID.
Features of TBT:
- Measures main thread blocking time during the critical loading phase (FCP to TTI).
- Calculated as the sum of all 'blocking portions' of long tasks (time exceeding 50ms).
- Expressed in milliseconds.
- Laboratory metric measured in synthetic testing environments.
Pros:
- Strong correlation with First Input Delay (FID), valuable for local testing and predicting real-world experience.
- Identifies specific JavaScript execution problems that cause poor interactivity.
- More sensitive to improvements than TTI, providing better feedback during optimization.
Cons:
- Not a field metric, doesn't capture real-user experience directly.
- Can be complex to understand compared to simpler metrics.
- Requires tools like Lighthouse for accurate measurement.
Examples of Successful TBT Reduction:
- The Financial Times: Reduced TBT by 86% through code splitting and tree shaking, leading to improved user engagement.
- Wix: Improved TBT by optimizing JavaScript execution order and implementing module chunking.
- Spotify: Reduced TBT by over 50% by optimizing React component rendering, significantly enhancing perceived performance.
Actionable Tips for Optimizing TBT:
- Use code splitting: Deliver critical JavaScript first, delaying non-essential scripts.
- Defer or remove non-essential third-party scripts: These can often be significant blockers.
- Implement web workers: Offload CPU-intensive tasks to separate threads.
- Optimize JavaScript execution: Eliminate unnecessary work during initial load.
- Use performance profiling in Chrome DevTools: Identify and address long tasks.
- Consider server-side rendering or static generation: For content-heavy pages, this can significantly improve initial load times and TBT.
- Implement progressive hydration (for JavaScript frameworks): Prioritize interactivity by hydrating components only when needed.
Learn more about Total Blocking Time (TBT) to dive deeper into how this metric can be used to improve your website's quality assurance testing strategy. By focusing on TBT, CEOs, CMOs, and marketing heads can ensure their development teams prioritize a smooth and responsive user experience, leading to higher user satisfaction and business success. This metric, popularized by the Google Lighthouse team, Addy Osmani, Paul Irish, and the Web Performance Working Group, has become a vital tool for anyone serious about website performance.
Website Performance Metrics Comparison
| Metric | Implementation Complexity 🔄 | Resource Requirements ⚡ | Expected Outcomes 📊 | Ideal Use Cases 💡 | Key Advantages ⭐ |
|---|---|---|---|---|---|
| Page Load Time | Moderate – requires full page monitoring | Moderate – network, server, client tools | Holistic page performance, user experience impact | General site performance and UX monitoring | Easy to understand, widely supported |
| Time to First Byte (TTFB) | Low to Moderate – backend focused | Low to Moderate – server/network tuning | Server responsiveness, backend bottleneck detection | Backend/server improvements, CDN and hosting optimization | Isolates server/network delays, critical for SEO |
| First Contentful Paint (FCP) | Moderate – frontend resource optimization | Moderate – rendering and asset management | Perceived load speed, initial content visibility | User experience improvement, SEO through Core Web Vitals | Focuses on first visible content, user engagement |
| Largest Contentful Paint (LCP) | Moderate to High – media/resource optimization | Moderate to High – image/video optimization | Main content load speed, user engagement | Optimizing above-the-fold large content, SEO | Reflects main content readiness, key ranking factor |
| Cumulative Layout Shift (CLS) | Moderate to High – layout and UI stability | Moderate – layout design and resource hints | Visual stability, user frustration reduction | UI stability-focused projects and dynamic content | Direct correlation with user frustration, SEO impact |
| First Input Delay (FID) | Moderate – JS optimization and event handling | Moderate – JavaScript profiling | Responsiveness to first user interaction | Interaction-heavy sites, user engagement | Reflects real input delays, impacts trust & SEO |
| Interaction to Next Paint (INP) | High – comprehensive JS/interaction optimization | High – advanced frontend engineering | Overall interactivity responsiveness | Full lifecycle user interaction measurement | More comprehensive than FID, better UX reflection |
| Total Blocking Time (TBT) | Moderate to High – JS task splitting & profiling | Moderate to High – dev tools and code refactor | Main thread blocking, user wait time for interactivity | Pre-launch lab testing and performance debugging | Strong correlation with FID, actionable insights |
Elevate Your Website's Performance with OneNine
Mastering website performance metrics is crucial for online success. From page load time and Time to First Byte (TTFB) to Core Web Vitals like First Contentful Paint (FCP), Largest Contentful Paint (LCP), and Cumulative Layout Shift (CLS), understanding and optimizing these metrics directly impacts user experience, search engine rankings, and ultimately, your bottom line. Remember, metrics like First Input Delay (FID), Interaction to Next Paint (INP), and Total Blocking Time (TBT) are equally important for gauging interactivity and responsiveness. By prioritizing these website performance metrics, you're not just improving technical aspects; you're investing in a better experience for your customers, driving engagement, and achieving your business objectives.
By optimizing your website’s performance, you create a seamless and engaging experience that encourages visitors to explore, convert, and return. A faster, more responsive site translates to higher user satisfaction, increased conversions, and improved brand loyalty. Don't let poor website performance hold your business back.
Ready to transform your website into a high-performing asset? OneNine specializes in optimizing website performance metrics across various platforms, including WordPress, Shopify, Webflow, and custom solutions. Visit OneNine today to learn how we can help you achieve exceptional website performance and unlock your online potential.


