
Website performance optimization is all about one thing: making your site faster for your visitors. It’s the behind-the-scenes work of shrinking images, cleaning up code, and speeding up your server so that every user has a smooth, quick experience. Get it right, and you’ll see a real impact on everything from search rankings to sales.
Why Website Speed Is a Business-Critical Metric, Not a Tech Problem
Let's stop thinking about site speed as just another task on a developer's to-do list. It's not. Website performance is a core driver of your business's success, and a slow site is a direct threat to your revenue, brand reputation, and customer loyalty.
Every extra second a user has to wait is another opportunity for them to leave. We've all done it—if a page hangs for too long, we hit the back button without a second thought. Your customers are exactly the same.
The Real-World Cost of a Slow Website
The financial hit from a slow website is staggering, and the data backs it up. Consider this: 47% of people expect a site to load in two seconds or less. Yet, the average is a sluggish 2.5 seconds on desktop and a painful 8.6 seconds on mobile.
That gap between expectation and reality is where you lose money. A single one-second delay can drop conversions by 7%. Worse, 44% of shoppers will tell their friends about a bad online experience, putting your brand's reputation at risk. After just three seconds of waiting, customer satisfaction plummets by 16%. If you're curious, you can find more data on how load times affect user behavior on the Hostinger blog.
This isn't just an e-commerce problem. For a B2B company, it means fewer demo requests. For a publisher, it means lower ad revenue. The cost is real and hits your bottom line directly.
A fast website isn't a "nice-to-have" anymore—it's the price of admission. Slow performance is like rolling out a welcome mat for your competitors.
Here's a clearer look at how those seconds add up and what they cost your business.
The Business Impact of Website Load Time
This table shows the direct correlation between website load time and critical business KPIs, highlighting the negative impact of delays and the positive lift from speed improvements.
| Load Time Delay | Impact on Conversion Rate | Impact on Customer Satisfaction | Impact on Bounce Rate |
|---|---|---|---|
| 0-1 Second | Optimal: Highest potential conversion rate. | Very High: Users are happy and engaged. | Very Low: Visitors stay and explore. |
| 1-3 Seconds | -7% to -12%: A significant drop for each second of delay. | -16%: Satisfaction drops noticeably after 3 seconds. | +32%: Users are much more likely to leave. |
| 3-5 Seconds | -20% to -25%: A substantial loss of potential sales. | Declining: Frustration begins to set in. | +90%: Bounce rate nearly doubles. |
| 5+ Seconds | -30% or more: Conversion rates plummet dramatically. | Very Low: Most users are annoyed or have left. | +123%: The vast majority of users will abandon the site. |
The takeaway is clear: even small improvements in load time can deliver a major boost to your key metrics, while even minor delays can cause significant damage.
Connecting Speed to Your Business Goals
When you treat performance as a strategic investment, you start to see how it directly impacts the numbers that matter.
- More Conversions: A fast, frictionless experience makes it easy for visitors to buy a product, fill out a form, or sign up for your newsletter.
- Better SEO Rankings: Google has been clear that page speed and Core Web Vitals are ranking factors. A faster site means more visibility and more organic traffic.
- Higher User Engagement: People stick around on fast sites. They view more pages, spend more time, and connect more deeply with your brand.
- Stronger Brand Perception: A snappy, reliable website makes you look professional and signals that you care about the customer experience. That builds trust.
Ultimately, investing in performance is investing in growth. It’s a move that pays for itself by creating a better experience for the people who keep your business running: your customers.
How to Run a Meaningful Website Performance Audit
Before you can fix a slow website, you have to play detective and figure out why it's slow. A real performance audit isn't about plugging a URL into a tool and chasing a perfect score. It's about digging into the data to find the specific bottlenecks that are frustrating your visitors and killing your conversions. This is how you move from guessing to knowing.
A performance audit is just one part of a bigger picture. It’s a critical piece of what a comprehensive site audit entails, which is essentially a full health check for your website. Think of it as the foundational first step.
The connection between speed and sales is painfully direct. A slow site frustrates users, they leave, and you lose money. It's that simple.
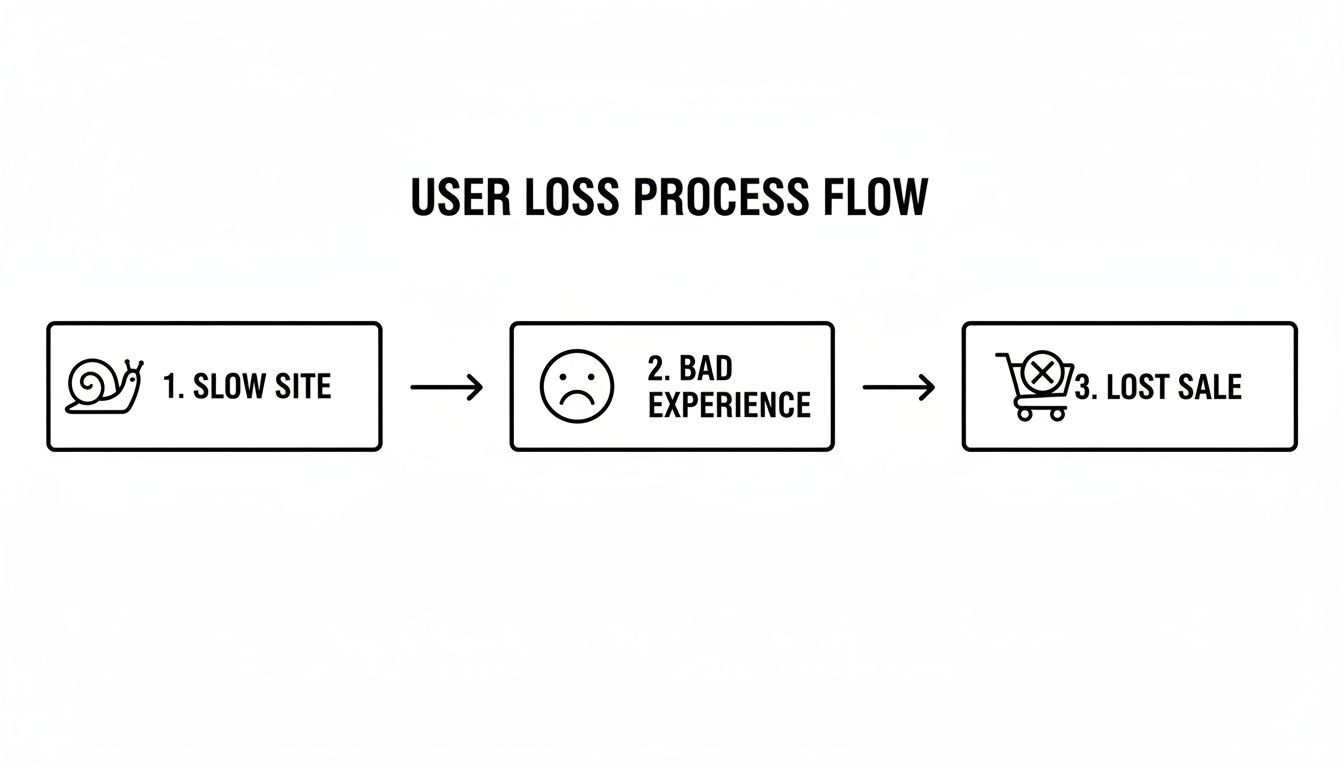
This flow really says it all: bad performance leads to a bad experience, which leads straight to abandoned carts and lost revenue.
Choosing Your Auditing Tools
You don't need a dozen different tools to get the job done. In my experience, a couple of reliable ones will give you the complete picture you need. The key is to get both lab data (a controlled, one-off test) and field data (how real users are actually experiencing your site).
- Google PageSpeed Insights (PSI): This one’s non-negotiable. It gives you lab data via Lighthouse and, if your site gets enough traffic, real-world field data from the Chrome User Experience (CrUX) Report. Seeing how your site performs "in the wild" is invaluable.
- GTmetrix: I love GTmetrix for its detailed diagnostics. It uses Lighthouse too, but the waterfall charts are fantastic for visualizing exactly how every single file loads. It makes spotting a specific, slow-loading asset incredibly easy.
- Chrome DevTools: Already built into your browser, the "Lighthouse" and "Performance" tabs are powerhouses for deep-dive technical analysis. You can get incredibly granular without ever leaving your own website.
To start, run your most important pages through both PSI and GTmetrix. Think homepage, key service or product pages, and your most popular blog posts.
Decoding the Metrics That Actually Matter
Performance reports can throw a dizzying amount of data at you. Forget about chasing a 100/100 score. Instead, focus on the metrics that directly influence how a user perceives your site's speed. Google's Core Web Vitals are the perfect place to start.
- Largest Contentful Paint (LCP): This is all about loading perception. It measures how long it takes for the main piece of content (usually a big image or block of text) to appear. You want this to be under 2.5 seconds. If it's slow, a massive, unoptimized hero image is often the culprit.
- Interaction to Next Paint (INP): The new kid on the block, INP measures how quickly your site responds when someone clicks, taps, or types. It’s all about responsiveness. A good INP score is anything below 200 milliseconds.
- Cumulative Layout Shift (CLS): Ever go to click a button, and an ad loads above it, pushing the button down? That's layout shift, and it’s incredibly annoying. CLS measures this visual stability. Aim for a score below 0.1.
Beyond the Core Vitals, keep a close eye on Time to First Byte (TTFB). This tells you how long it takes for your server to even start sending data. A high TTFB (over 800ms) is a major red flag for back-end issues. No amount of front-end optimization can fix a slow server.
Our guide includes a comprehensive ultimate website audit checklist to make sure you're looking at all the right places.
The real goal of an audit isn't just to find a long list of problems. It's to find the right problems to fix first. A huge, uncompressed image slowing down your LCP is a much bigger deal than a minor code minification issue.
Creating Your Action Plan
With your reports in hand, it’s time to build a roadmap. Don't just stare at a list of 50 recommendations. Look for patterns.
Are oversized images a recurring problem on every page? Is your server response time consistently slow?
Start grouping similar issues into buckets like "Image Optimization," "Code Cleanup," or "Server & Hosting." Then, rank those buckets by how much they're hurting your Core Web Vitals. Just like that, you've turned a chaotic mess of data into a clear, prioritized action plan.
Implementing High-Impact Front-End and Back-End Fixes

Alright, you've done the audit and have a hit list of what’s slowing things down. Now for the fun part: rolling up your sleeves and actually making your site faster. Think of this as a two-front war. You need to attack the front-end (everything a user’s browser has to deal with) and the back-end (your server and infrastructure). Let's get into the fixes that deliver the biggest bang for your buck.
And you need to take this seriously. Slow websites are costing retailers a mind-boggling $2.6 billion a year in lost sales. If a page takes more than two seconds to load on mobile, bounce rates can jump to 87%. For entrepreneurs, the numbers are just as stark: 45% of people won't buy from a slow site, and 37% won't ever come back. You can see more data on how speed impacts revenue in these detailed website statistics and trends.
Master Your Front-End Performance
Most of what users perceive as "slow" happens right here on the front-end. The goal is simple: reduce the size and number of files the browser has to download to show your page.
First up, and it's a big one, is optimizing your images. I can't tell you how many times I've seen a site brought to its knees by giant, uncompressed images.
- Smart Compression: Use a tool like TinyPNG or ImageOptim to shrink file sizes without making your photos look grainy. It’s a crucial first step.
- Modern Formats: Switch from old-school JPEGs and PNGs to next-gen formats like WebP. Google developed it for a reason—it offers way better compression and can cut file sizes by 25-35% or more.
- Lazy Loading: This is a non-negotiable. Lazy loading tells the browser not to load images "below the fold" until the user actually scrolls down to them. It makes that initial page view feel so much snappier.
For a much deeper look at these techniques, check out our complete guide on how to optimize website images.
Next, let's clean up your code. Every comment, every extra space, every unnecessary line in your CSS and JavaScript files adds to the page weight. The process of stripping all that out is called minification.
You could do it by hand, but who has time for that? Most modern caching plugins and development tools can handle this for you automatically. The aim is to get those files as lean as possible so they download and run in a flash.
Finally, you absolutely have to use browser caching. This is where you tell a visitor's browser to save a local copy of your static files—your logo, CSS, fonts, etc. When they come back or visit another page, the browser just grabs the local files instead of downloading them all over again. It’s what makes repeat visits feel almost instant.
Fortify Your Back-End Infrastructure
A speedy front-end won't matter much if it's sitting on a slow, creaky server. Your back-end is the foundation, and if you cut corners here, you're just setting yourself up for a slow site.
Your web hosting choice is ground zero. That cheap shared hosting plan might seem like a good deal, but you'll pay the price with agonizingly slow server response times (high TTFB) and crashing the moment you get a little traffic. Invest in good managed hosting or a dedicated server. It’s worth every penny.
A Content Delivery Network (CDN) is another game-changer, especially if your audience isn't all in one city. A CDN basically takes copies of your site's assets—images, scripts, stylesheets—and stores them on servers all over the world.
When someone visits your site, the CDN serves those files from a server that’s physically close to them. This simple change dramatically cuts down on latency and makes everything load faster.
Think of your back-end as the engine of your car. You can have the most aerodynamic, beautifully designed car in the world (your front-end), but if it has a lawnmower engine (your back-end), it’s never going to win a race.
The last piece of the back-end puzzle is server-side caching. This is where your server stores a pre-built HTML version of a page. So, instead of having to query the database and assemble the page from scratch for every single visitor, it just serves up the ready-made copy. It’s incredibly efficient.
Applying Fixes to Your Platform
How you actually do all this depends a lot on the CMS you're using.
- WordPress: A top-tier caching plugin like WP Rocket is your best friend. It can handle caching, minification, lazy loading, and more with just a few clicks. For images, plugins like Imagify or ShortPixel will automate the compression and WebP conversion for you.
- Shopify: The big performance killer here is often "app bloat." Every app you add can pile on more CSS and JavaScript, slowing things down. Do a regular audit and be ruthless about deleting any apps you don't absolutely need. For images, look into apps like Crush.pics to automate the optimization.
- Webflow: The good news is that Webflow handles a lot of this for you. It has a built-in global CDN and automatically optimizes images. Your job is mainly to make sure you're using responsive images correctly and to be mindful of how many third-party scripts you're adding.
Setting a Performance Budget to Prove ROI
Making your website faster isn't just a nice-to-have; it's a strategic business move that needs a solid plan with measurable results. This is exactly where a performance budget comes into play. Think of it like a financial budget, but instead of tracking dollars, you're carefully managing kilobytes and milliseconds to keep your site lean and fast.
A performance budget sets hard limits on how "heavy" your pages can get. It’s a simple but incredibly effective way to stop the slow, gradual decline in speed that happens as teams add new features, high-res images, and third-party scripts over time. By setting these rules from the start, you build a framework that forces everyone to make smarter decisions, protecting the user experience and, more importantly, your bottom line.
From Technical Metrics to Business Goals
First things first, you need to decide what "fast" actually means for your business. Instead of a vague goal like "make the site faster," you need specific, measurable targets. These aren't just for the developers; they're the technical guardrails that protect your most important business KPIs.
Here are a few common metrics people use for their performance budgets:
- Total Page Size: A great goal is to keep key pages under 1.5 MB. Heavier pages are a direct cause of slow load times, especially for users on mobile data.
- Largest Contentful Paint (LCP): Aim for an LCP under 2.5 seconds. This ensures the main content pops up quickly, letting visitors know the page is actually working.
- Number of HTTP Requests: Try to stay below 75 requests per page. Every script, image, and font file is a separate request that adds a tiny delay. They add up fast.
Setting these limits forces you to have critical conversations. For example, is that flashy new marketing video worth blowing your page size budget? Does that third-party analytics script justify adding five more HTTP requests and slowing down the experience for every single visitor?
Justifying the Investment with Hard Numbers
This is the part where performance optimization stops being a technical chore and starts becoming a revenue-generating activity. The real magic of a performance budget is how it connects technical tweaks directly to the financial health of your business. You need to build a compelling case that shows exactly how speed impacts sales, leads, and customer retention.
Let's say you run an e-commerce site. After digging into your analytics, you find that for every 500 milliseconds you shave off your load time, your conversion rate jumps by 2%. If your current LCP is a sluggish 4 seconds and you set a budget to bring it down to 2.5 seconds, that's a 1.5-second improvement.
Based on your own data, that could mean a 6% lift in conversions. If your store does $500,000 in annual revenue, that 6% increase translates to an extra $30,000 a year. All of a sudden, the cost of hiring a specialist or investing in better infrastructure looks like a no-brainer.
A performance budget turns abstract technical goals into a concrete business case. It’s the language you use to show stakeholders that investing in speed isn't an expense—it's an investment with a clear, predictable return.
Tracking and Proving Your Success
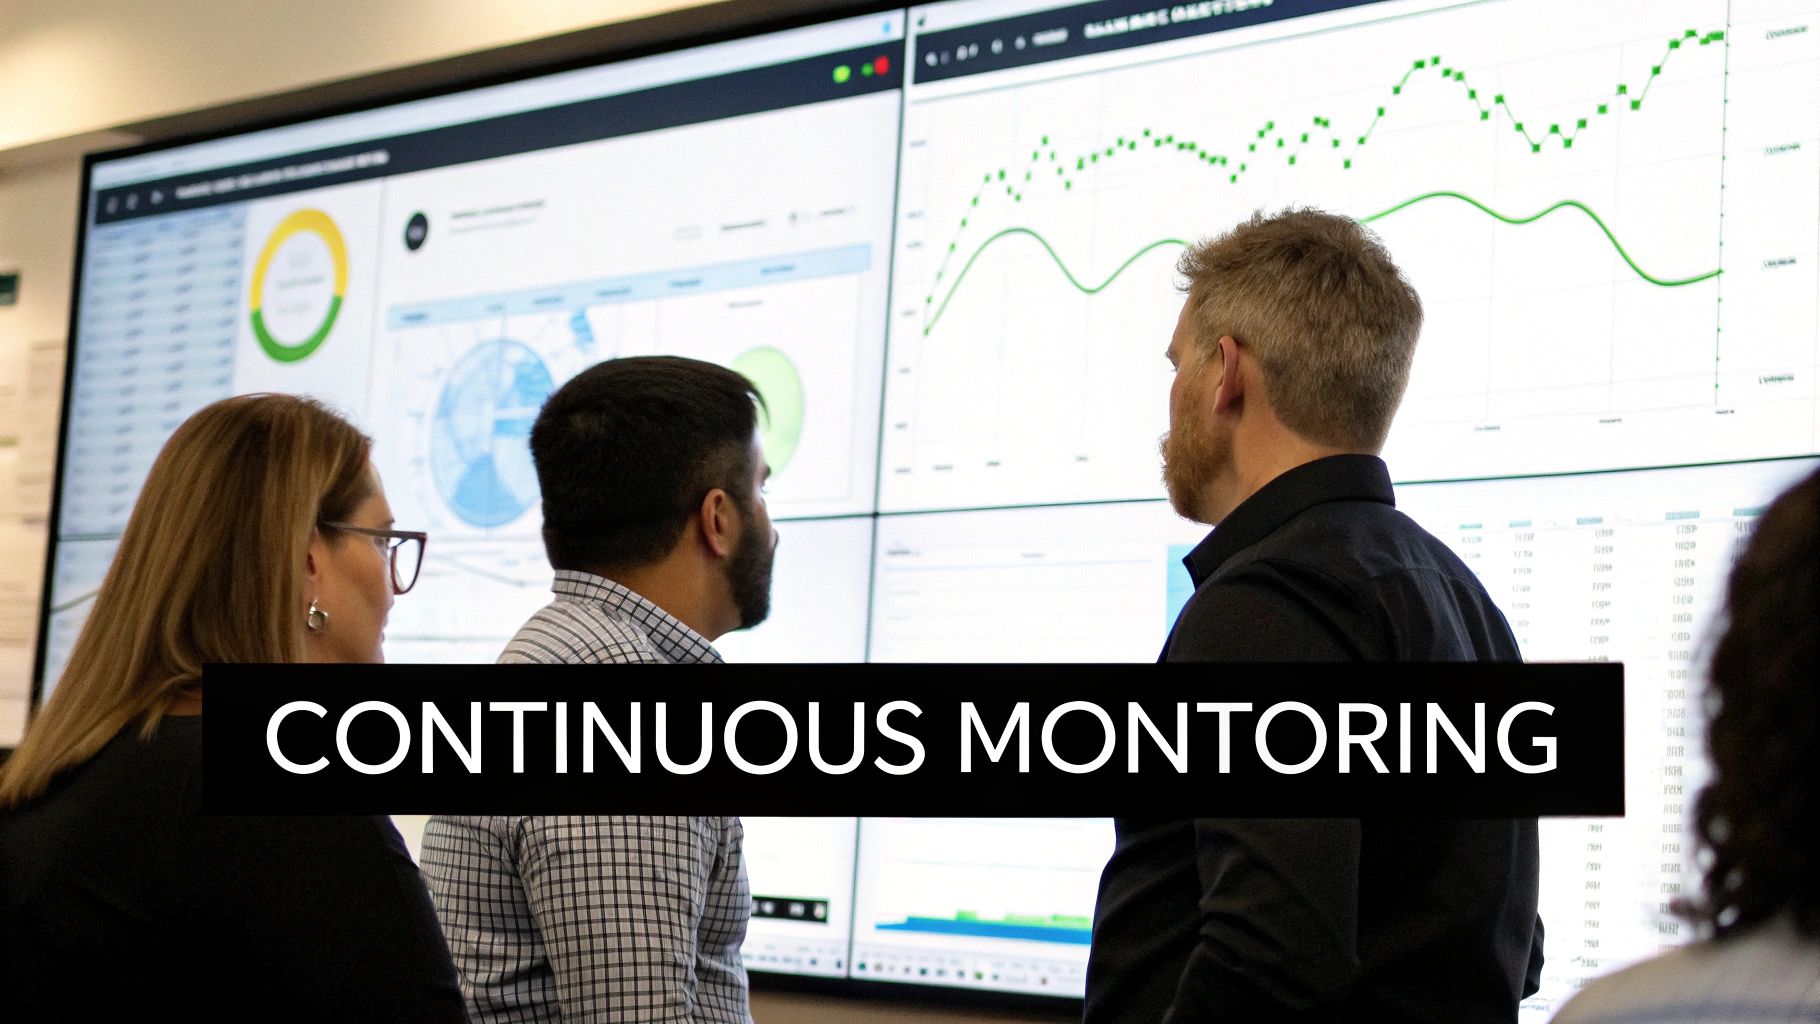
Once you’ve rolled out your fixes, the job isn't done. Now you have to track both your performance metrics and your business KPIs to prove the whole thing was worth it. Set up a dashboard where you can see your LCP, page size, and other budget metrics right alongside your conversion rates, bounce rates, and average order value.
This continuous monitoring is how you demonstrate the real-world impact of your team's work. To learn how to frame these results effectively, check out this guide to measuring marketing ROI. It’ll help you present your findings in a way that resonates with everyone, from marketing to the C-suite. When you can draw a straight line from speed to profit, you make a powerful case for website performance as a permanent part of your business strategy.
Building a Continuous Performance Monitoring Workflow
Getting your site to load quickly is a fantastic accomplishment, but the job is never truly done. Website performance isn't a "set it and forget it" project. It's an ongoing commitment, because without a system to keep an eye on things, that fast site will inevitably slow down as new features, marketing scripts, and content pile up.
This is where a continuous monitoring workflow comes in. It flips the script from reactive firefighting to proactive, predictable management of your site's health. You stop scrambling to fix problems and start preventing them from happening in the first place. The goal is to build a sustainable loop: test, monitor, and refine.
Setting Up Your Automated Sentry
Automation is the bedrock of any solid monitoring strategy. Let's be honest, nobody has time to run manual speed tests every day, and even if they did, it wouldn't be reliable. What you need are tools that act as a 24/7 watchdog, alerting you the second performance starts to degrade.
Many performance tools, like GTmetrix, offer automated monitoring that can track your key metrics over time. You can schedule it to run daily or weekly checks on your most important pages—think homepage, key product pages, and your checkout flow. These tools will then chart your performance, making it dead simple to spot a negative trend before it snowballs into a major problem.
The real magic happens when you set up performance alerts. You can configure these tools to ping you via email or Slack if a metric falls below a certain threshold. Imagine getting a heads-up when:
- LCP Alert: Your Largest Contentful Paint creeps above 2.8 seconds.
- Page Size Alert: The total page weight blows past your 1.5 MB budget.
- Score Alert: An overall performance score drops by more than 10 points.
These automated pings are your early warning system. They give your team a chance to investigate and roll back a problematic change quickly, often before most users even notice there was an issue.
A great monitoring workflow catches a problem when it's small. It's the difference between a quick five-minute fix and a frantic, site-wide emergency a month later.
The Importance of Regular Re-Audits
While automated monitoring is your first line of defense against sudden dips, it doesn't replace the need for deep, periodic audits. Think of it this way: your automated alerts are smoke detectors, but a full audit is the annual fire safety inspection. You absolutely need both.
A full re-audit, maybe once a quarter, lets you step back and see the forest for the trees. It’s the perfect time to reassess your performance budget, hunt for new optimization opportunities, and make sure your site is still aligned with the latest best practices. These check-ins are especially crucial after big changes, such as:
- After a Redesign: A new theme or layout can bring a whole host of new performance gremlins to the surface.
- Launching New Features: Adding a complex plugin or third-party app demands an immediate performance check.
- During Major Campaigns: Those new tracking scripts for a big marketing push can unexpectedly drag your site down.
These planned re-audits create a rhythm of improvement and keep performance front-and-center as your site evolves. A deep dive into the right metrics is essential, and you can learn more about which numbers to watch by exploring these crucial website performance indicators.
Using A/B Testing to Validate Changes
So, you've made a change you think will improve performance. How do you know if it actually helped your business goals? You test it. A/B testing isn't just for button colors and headlines; it's an incredibly powerful tool for proving the value of your optimization work.
For instance, you might have a hunch that switching to a premium CDN will boost conversion rates for international customers. Instead of just hoping, you can run a split test. Route a portion of your international traffic through the new CDN while the rest stays on the old setup. By tracking conversion rates for both groups, you get cold, hard data on the ROI.
This is how you connect technical fixes directly to business outcomes. It helps you focus on the tweaks that actually move the needle and builds an undeniable case for continued investment in speed. When you combine automated monitoring, regular audits, and strategic testing, you create a powerful, sustainable workflow that keeps your site fast, your users happy, and your business growing.
Still Have Questions About Website Performance?
Even with a solid plan, you're bound to have some questions. That's a good thing—it means you're thinking critically about what matters. Let's dig into a few of the most common questions I hear from business owners and marketers.
How Often Should I Run a Performance Audit?
For a full, deep-dive audit, I recommend doing it quarterly. This cadence is frequent enough to catch issues before they snowball but not so often that you get lost in the data. It gives you a consistent pulse on your site's health.
That said, you can't just set it and forget it. You should also run quick checks anytime you make a significant change. Did you just install a new app or plugin? Launch a big campaign with new tracking pixels? Switch themes? Run a quick test. This shifts your approach from putting out fires to proactively keeping your site fast and healthy.
What’s a "Good" Page Load Time?
The standard industry answer is under 2.5 seconds. This number comes directly from Google's Core Web Vitals benchmark for Largest Contentful Paint (LCP), so it's a great starting point.
But let's be real—the best sites, especially in the competitive e-commerce world, are often clocking in at under 1.8 seconds. Your goal isn't just to hit an arbitrary number; it's to deliver an experience that feels instant and keeps people from bouncing.
The real question isn't "Am I fast enough for Google?" It's "Am I faster than my competition?" You want to create an experience so seamless that customers don't even think about going anywhere else.
Can I Improve My Site Speed Without a Developer?
Yes, absolutely! While some of the heavy lifting requires a technical expert, there are a few high-impact fixes that anyone can tackle.
If you’re ready to get your hands dirty, here’s where I’d start:
- Shrink Your Images: This is the low-hanging fruit of site speed. Before you upload any image, run it through a compression tool. It’s often the single biggest win for non-coders.
- Clean Out Your Plugins and Apps: Every app you add to your WordPress or Shopify site adds more code and slows things down. Be ruthless. If you aren't using it, lose it.
- Get a Good Caching Plugin: On WordPress, installing a tool like WP Rocket can take care of a lot of complex backend work with just a few clicks. It's a massive shortcut.
Once you get into things like minifying code, optimizing your server, or tackling render-blocking resources, it's usually smarter and safer to bring in a professional. That way, you get the results you want without accidentally breaking your site.
How Much Does Website Performance Actually Affect SEO?
It's a huge deal, and it's becoming more important every year. Google's Core Web Vitals are a direct ranking signal because they measure real-world user experience. A slow, janky website is a bad experience, period.
Think about the chain reaction: a slow site causes higher bounce rates and lower time on page. Those are both strong signals to search engines that your content isn't a good match for what the user was looking for, which can tank your rankings over time.
On the flip side, a fast, snappy website gets rewarded with better visibility in the search results. Honestly, improving your site speed is one of the most reliable technical SEO moves you can make to see a direct, positive impact on your organic traffic.
At OneNine, we live and breathe this stuff. We know that turning your website into a high-performing, revenue-driving machine is more than just a technical task—it's a core business strategy. If you're ready to get serious about speed, our team is here to handle all the technical details so you can stay focused on growing your business.
Learn more about our website management services and let us help you build a faster, more profitable online presence.


