

Want to improve your website’s performance and user engagement? Start by tracking user behavior.
Here’s what you need to know:
Key Metrics to Track
- Page Views: Total pages viewed per session.
- Bounce Rate: Percentage of users leaving after one page.
- Time on Site: Average session duration.
- Click-Through Rate (CTR): Percentage clicking on links or buttons.
- Scroll Depth: How far users scroll on a page.
Tools to Use
- Google Analytics: Tracks traffic sources, user flow, and content performance.
- Heatmaps: Visualizes where users click and scroll the most.
- Session Recordings: Captures real-time user interactions to spot issues.
Steps to Start
- Set clear goals (e.g., increase time on page or reduce bounce rate).
- Install tools like Google Analytics, heatmaps, and session recorders.
- Regularly review data and update your strategies based on insights.
Tracking user behavior helps optimize content, improve navigation, and boost conversions. Ready to start? Dive into the tools and techniques to transform your website!
Hotjar Tutorial: Setting Up and Analyzing Website User Behavior
User Tracking Tools
Understanding user behavior starts with the right tools. These tools turn raw data into meaningful insights about how visitors interact with your website.
Using Google Analytics
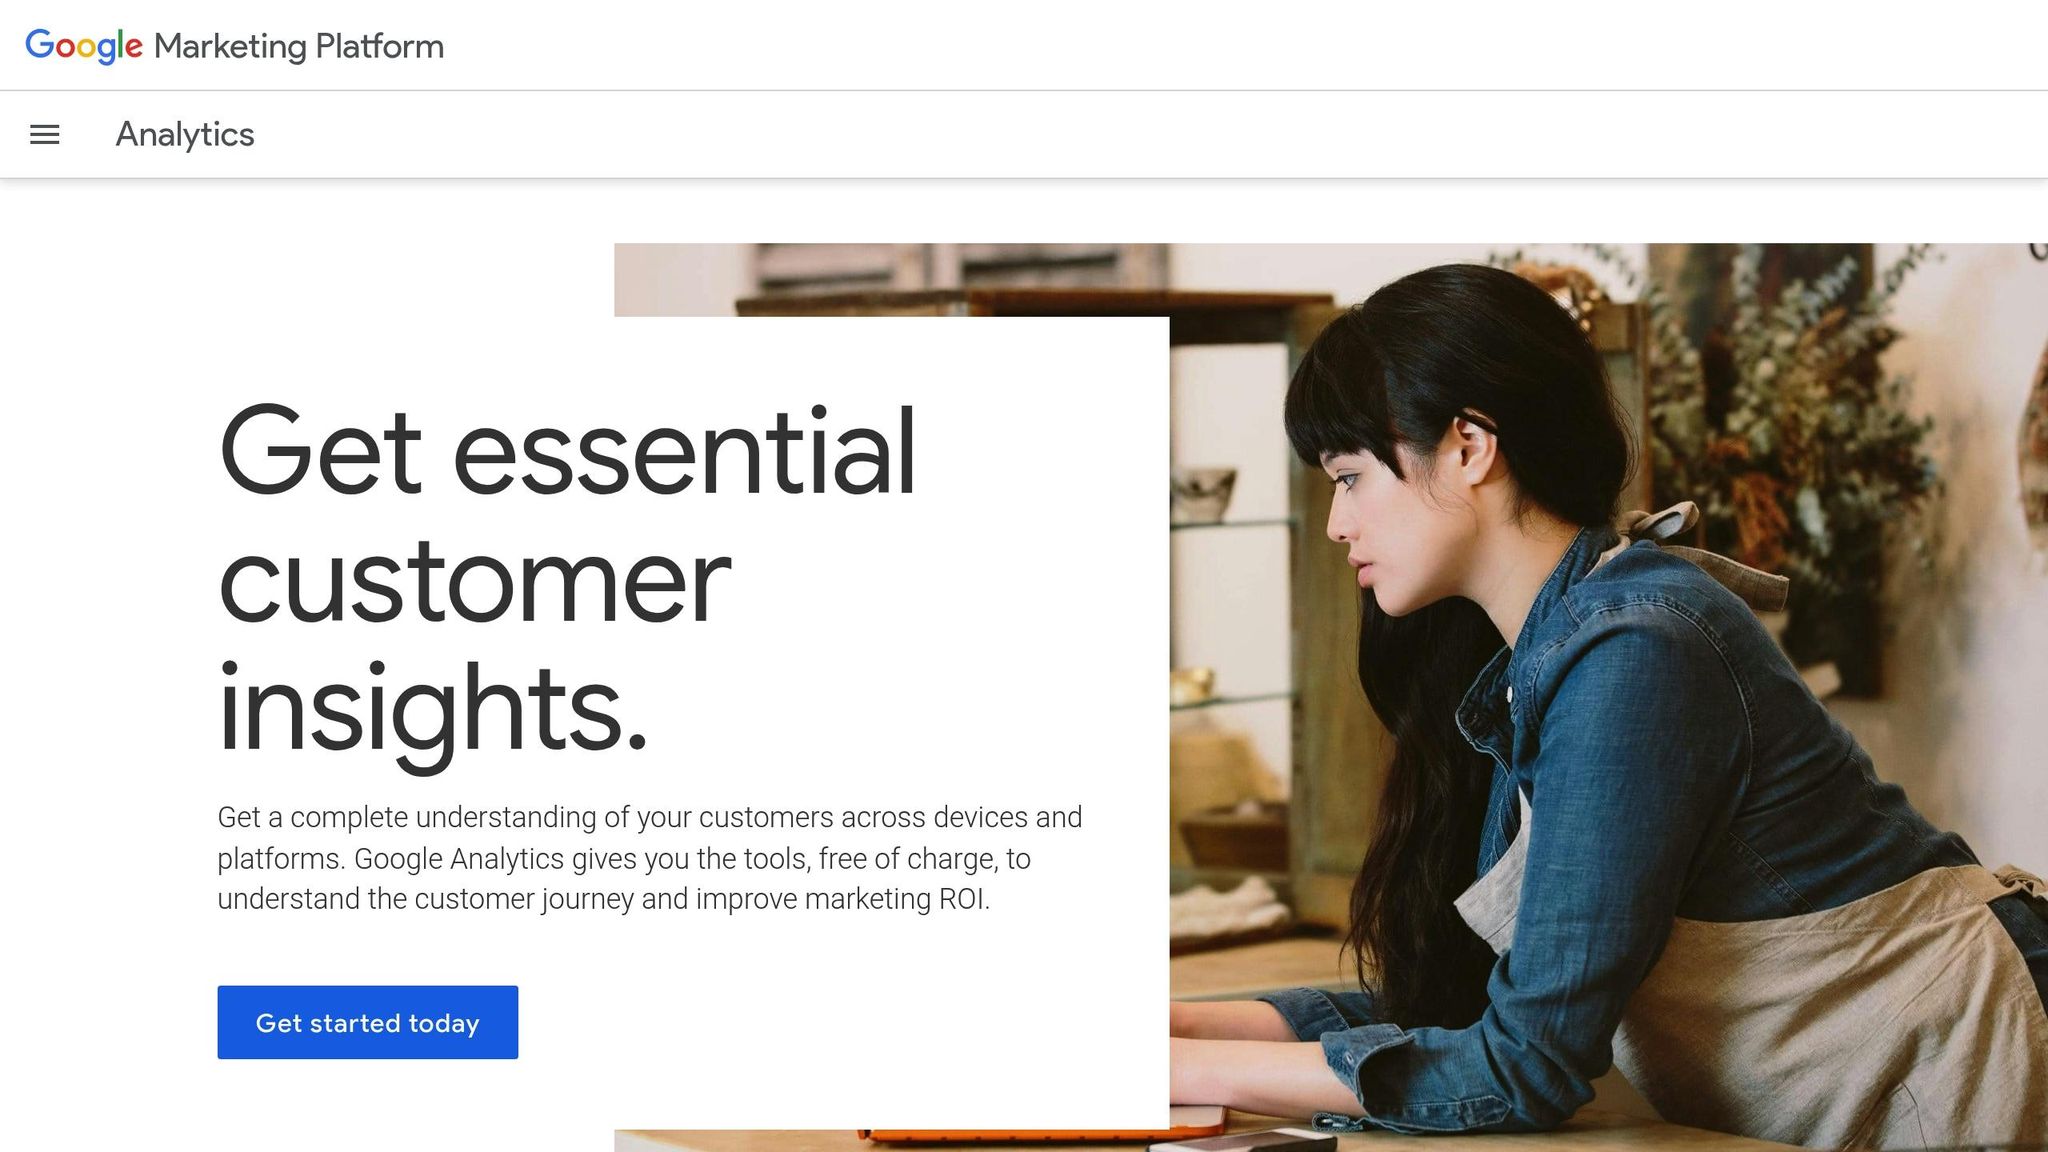
Google Analytics provides a wealth of information to help you analyze user behavior:
- Traffic Sources: See where your visitors are coming from.
- User Flow: Understand how users navigate through your site.
- Content Performance: Discover which pages or articles engage your audience the most.
- Device Usage: Learn how users access your site – desktop, mobile, or tablet.
You can also set up custom event tracking to monitor specific actions, like newsletter signups or form submissions. Pairing this with heatmap tools can give you a fuller picture of how users interact with your site.
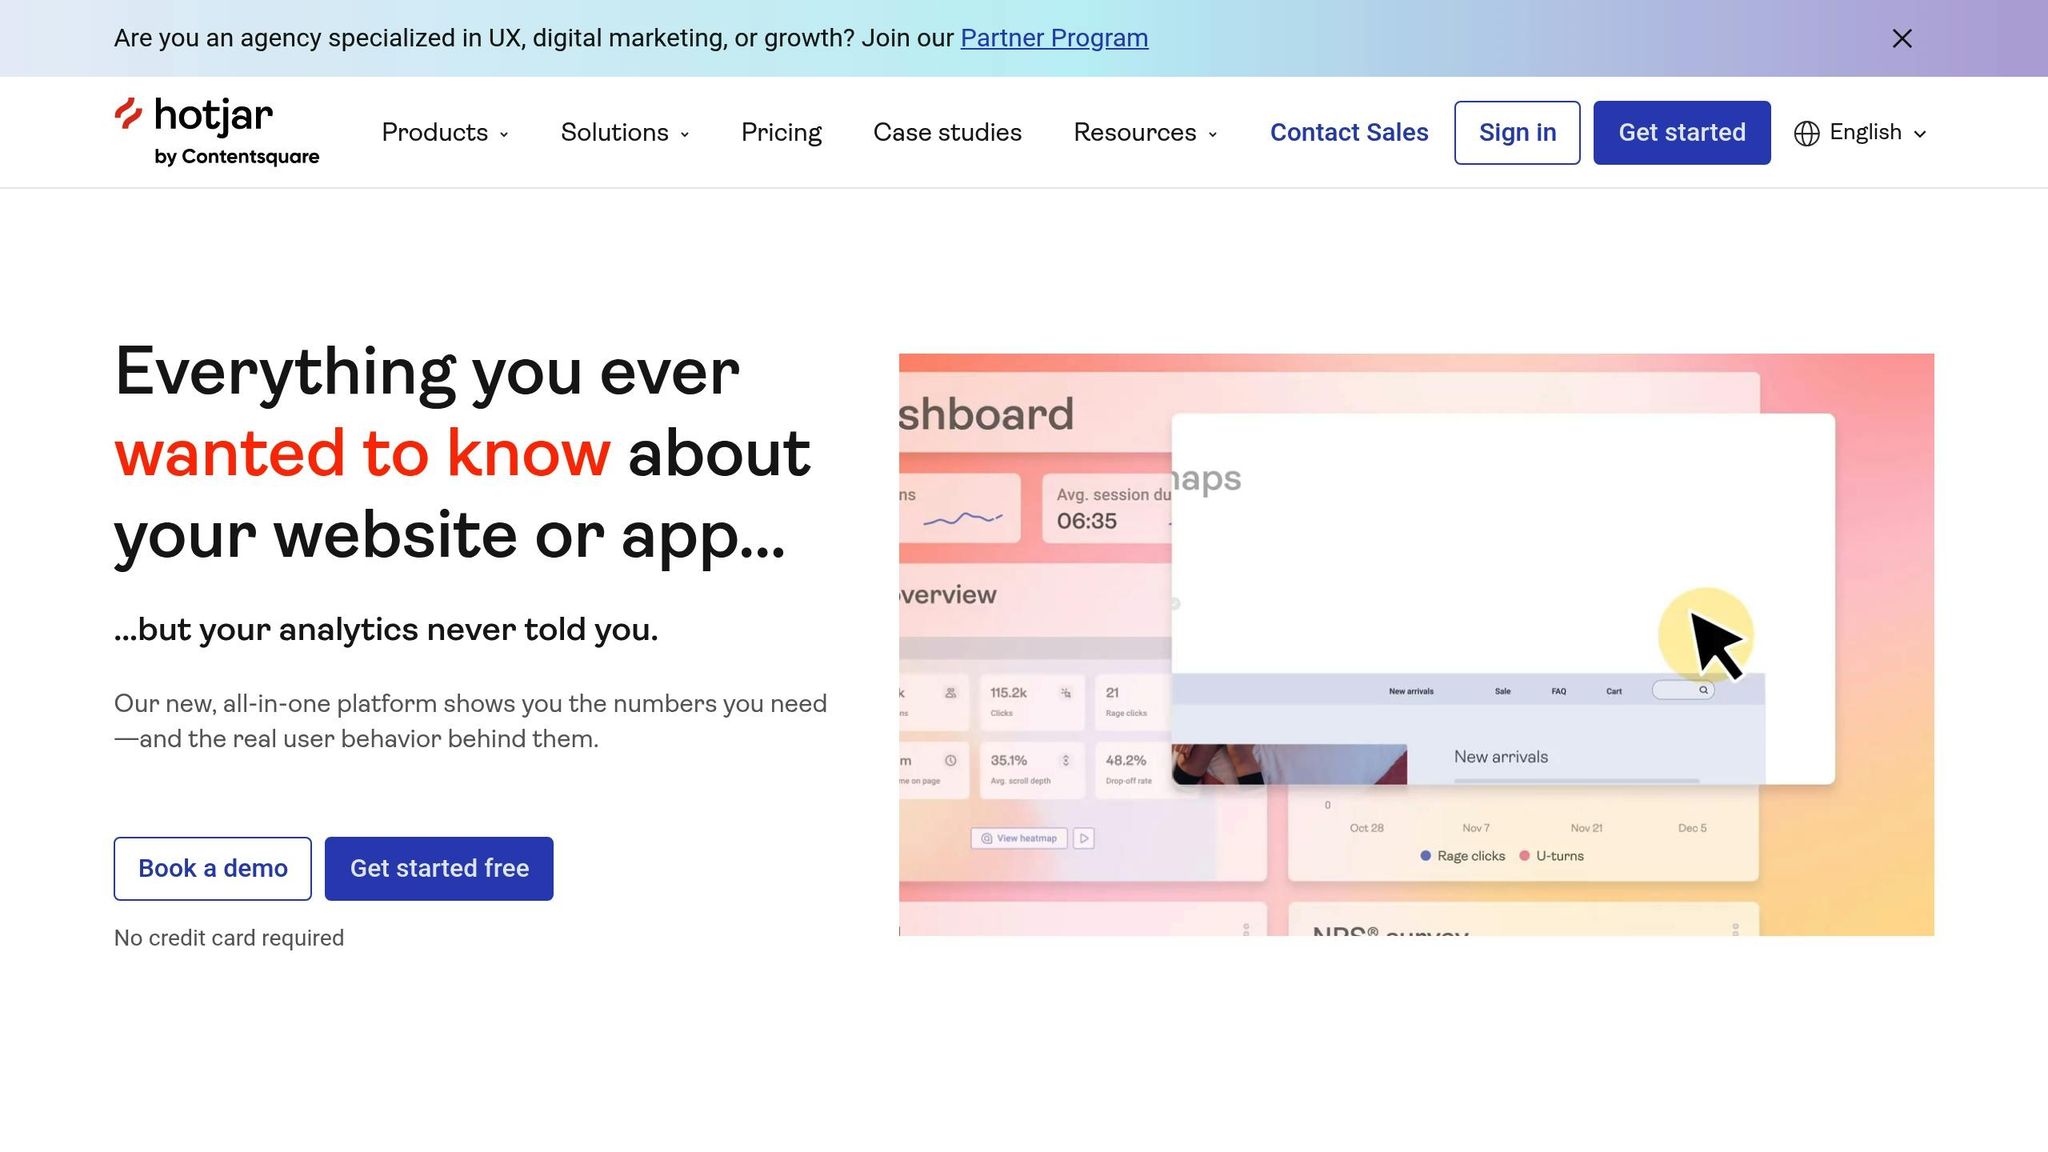
Heatmap Tools
Heatmaps provide a visual representation of user engagement, using colors to show where users interact most (red for high activity, blue for low). They also reveal how far users scroll down your pages, helping you understand what content gets attention.
For example, when OneNine used heatmaps for a news website, they found that crucial call-to-action buttons were being overlooked because they were placed below the fold. By moving these elements higher on the page, click-through rates improved significantly.
User Recording Tools
Session recording tools capture real-time user interactions, offering a detailed look at how visitors experience your site. These tools can help you:
- Spot navigation issues by watching how users move through your site.
- Identify technical glitches where users encounter errors.
- Understand how users read and engage with your content.
In one case, OneNine’s UX team used session recordings to observe mobile users struggling with a complex navigation menu. By redesigning the menu for simplicity, they enhanced the mobile experience, leading to longer session durations.
Comparing Tracking Tools
Here’s a quick comparison of the tools discussed:
| Tool Type | Primary Use Case | Key Benefits |
|---|---|---|
| Google Analytics | Traffic and behavior analysis | Detailed metrics and custom tracking |
| Heatmaps | Visual engagement tracking | Easy-to-read interaction insights |
| Session Recordings | User journey analysis | Real-time problem identification |
sbb-itb-608da6a
Setting Up User Tracking
Setting up user tracking the right way can turn raw data into meaningful insights, helping you improve your content strategy.
Set Your Goals
Start by identifying clear and measurable goals that tie directly to your business objectives. Here are a few examples:
| Goal Category | Example Metrics | Target Range |
|---|---|---|
| Content Engagement | Time on page, scroll depth | 3–5 minutes, 75% scroll |
| User Behavior | Navigation paths, click patterns | 3+ page visits per session |
| Conversion Actions | Newsletter signups, comments | 2–5% conversion rate |
Focus on metrics that matter for your content strategy. For instance, if you run a blog, prioritize metrics like reading time or social shares over simple pageviews. Once your goals are set, you can move on to installing the right tracking tools.
Install Tracking Tools
To collect accurate data, you’ll need to set up tracking tools effectively. Here’s a breakdown:
-
Google Analytics Setup
- Create a Google Analytics 4 property.
- Enable enhanced measurement features.
- Define and set up conversion events.
- Configure user properties for better segmentation.
- Establish data streams for consistent tracking.
-
Heatmap Implementation
- Add heatmap tracking code after setting up analytics.
- Define areas to track clicks and scrolls.
- Set scroll depth triggers to monitor user engagement.
- Enable movement tracking for deeper insights.
-
User Recording Configuration
- Set up session recording while protecting user privacy:
- Exclude sensitive form fields from recordings.
- Limit recording duration to avoid unnecessary data.
- Define triggers for starting and stopping recordings.
- Set clear storage rules for recorded data.
- Set up session recording while protecting user privacy:
Once these tools are in place, ensure you review their configurations regularly to maintain accuracy.
Review and Update
Tracking data isn’t static – it requires regular reviews to stay effective. Here’s how you can stay on top of it:
| Review Element | Frequency | Key Actions |
|---|---|---|
| Data Quality | Weekly | Check for tracking gaps. |
| Goal Progress | Monthly | Fine-tune tracking settings. |
| Tool Performance | Quarterly | Update tracking scripts. |
| Privacy Compliance | Bi-annually | Review consent settings. |
Results of User Tracking
Tracking user behavior effectively can lead to measurable improvements in engagement and conversions.
Better User Experience
Analyzing user behavior uncovers key areas to improve the overall experience. By examining how users interact with your site, you can identify issues like confusing navigation, poorly designed layouts, or technical glitches that frustrate visitors.
When tracking behavior across devices, pay attention to these metrics:
| Device Type | Metrics | Goals for Improvement |
|---|---|---|
| Desktop | Scroll depth, click accuracy | Streamlined navigation, better content layout |
| Mobile | Touch interactions, page load time | Easy-to-use menus, faster page loads |
| Tablet | Viewport usage, form completions | Responsive design, smoother input methods |
Content Improvements
Data from tracking tools can highlight which content resonates with users and which falls short.
| Metric | Ideal Range | Suggested Actions |
|---|---|---|
| Time on Page | 3+ minutes | Add more detailed, engaging content |
| Bounce Rate | Under 55% | Refine content relevance and opening hooks |
| Scroll Depth | 75%+ completion | Restructure content for better flow and readability |
In March 2023, OneNine revamped Jake Loeffler’s outdated website, significantly improving mobile performance and lead generation. The redesign also boosted organic rankings for key keywords, resulting in higher conversions. [1]
Refining your content strategy based on tracking data can pave the way for better engagement and conversions.
Higher Conversion Rates
To turn visitors into customers, you need to optimize every step of the user journey. Tracking tools help pinpoint where users drop off and where improvements can be made.
Key areas to monitor for better conversions include entry points, navigation paths, exit pages, and form interactions. Regularly reviewing user recordings and heatmaps can reveal:
- Which entry points bring in the most engaged visitors
- Navigation paths where users lose interest
- Exit pages that hinder conversions
- Form elements that need adjustments for higher completion rates
Conclusion
Summary
Tracking user behavior effectively can transform content websites by turning data from analytics, heatmaps, and recordings into actionable strategies. Monitoring metrics like scroll depth, time spent on a page, and conversion paths allows businesses to make informed decisions and improve their website’s performance.
Key advantages of tracking include:
- Improved understanding of engagement patterns
- Data-based content adjustments
- Better experiences across devices
- Increased conversion rates
Use these insights to drive meaningful improvements for your business.
OneNine Services

OneNine specializes in website management, offering advanced tracking and analytics to deliver measurable outcomes. Here are some real-world examples of their success:
| Client Success Stories | Results |
|---|---|
| Jake Loeffler | Boosted mobile performance and lead generation through a strategic redesign in March 2023 [1] |
| Ernest Chapman | Achieved a 700% improvement in site speed, cutting load times to about 1 second |
| Debra Rinell | Expanded from managing a single site to overseeing an entire portfolio |
OneNine’s offerings include:
- Daily performance and speed testing
- Access to real-time analytics dashboards
- Personalized support from dedicated account managers
- Regular security updates and monitoring
- Full-service content management solutions
For businesses aiming to elevate their user tracking and website performance, OneNine provides the tools and expertise to make it happen.


