

Let's talk about bounce rate. In Google Analytics, it’s the percentage of visitors who land on one of your pages and then leave without doing anything else.
Imagine someone walks into your shop, takes a quick look around, and walks right back out. That’s a bounce. It’s a powerful sign that there might be a mismatch between what someone was looking for and what your page gave them.
What Bounce Rate Actually Means
At its heart, bounce rate tells you how many people aren't sticking around on a specific page. In the old days of Universal Analytics (UA), which was the standard until 2023, the calculation was incredibly blunt.
A session was a bounce if a visitor landed on a page and left without clicking to another page or triggering an event. That means someone could have spent ten full minutes reading every word of your latest article, but if they didn't click anything else, UA still counted them as a bounce.
This old way of measuring things caused a lot of headaches. It often painted a misleading picture, lumping genuinely engaged readers in with people who left immediately. Historically, you'd see average bounce rates somewhere between 26% and 70%. The problem was, this single number ignored crucial factors like how long someone stayed or how far they scrolled down the page.
The Problem with the Old Model
This created a real dilemma. A high bounce rate could mean a few very different things, and not all of them were bad.
- Maybe the visitor found exactly what they needed and left happy.
- Or, the page content was totally irrelevant to them.
- It could also signal a poor user experience, like a painfully slow load time.
This is where the new engagement metrics in GA4 come into play, offering a much richer story.

This kind of dashboard puts engagement front and center, which is the big shift in GA4. Because of all the flaws in the old system, Google completely rethought the concept. They moved the goalposts from simply tracking exits to understanding genuine user engagement. This change is absolutely central to learning how to analyze website traffic today.
The Big Shift to Google Analytics 4
The whole story of bounce rate in Google Analytics changed dramatically with the arrival of Google Analytics 4 (GA4). The old system, Universal Analytics (UA), had a pretty big flaw—it often marked perfectly happy visitors as "bounces."
Think about it this way: someone lands on your blog, spends ten minutes reading a fantastic 2,000-word article, gets the exact answer they needed, and then leaves. In the old world of UA, that was a bounce. Why? Because they didn't click to a second page.
This created a real headache. The old definition didn't measure actual engagement. It was a one-trick pony, only caring if a user visited more than one page. This narrow view often led people to believe their content was failing when, in reality, it was doing its job perfectly by solving a user's problem on a single page.
A New Way of Thinking About Engagement
GA4 completely rethinks this outdated idea. Instead of obsessing over single-page sessions, it introduces a much smarter, more positive metric called Engagement Rate. The bounce rate in GA4 is now just the inverse of the engagement rate. Simple. If a session wasn't "engaged," it's a bounce.
This changes the game. After Universal Analytics was sunset in 2023, GA4 became the standard, and with it came a much more useful definition of a bounce. A session is now considered engaged (and therefore not a bounce) if it meets at least one of these conditions. You can read more about GA4's approach to user engagement on tendocom.com.
GA4 defines bounce rate as the percentage of sessions that were not engaged sessions. This simple flip marks a huge shift from tracking simple exits to measuring meaningful interactions.
So, what does GA4 consider an "engaged session"? The criteria are much more in tune with how people actually use the web today.
- The session lasts longer than 10 seconds.
- The session triggers a conversion event.
- The session includes at least two pageviews or screenviews.
Why the New Method Is a Huge Improvement
This modern approach finally recognizes when users are actively reading, watching, or interacting with your content, even if they don't leave the page. Remember that person who spent ten minutes reading your blog post? Under GA4, they are correctly counted as an engaged user, not a bounce.
This makes the bounce rate in Google Analytics 4 a far more reliable and meaningful signal of how your pages are actually performing.
To really nail down the differences, let's compare how the two platforms calculate a bounce.
How Bounce Rate Is Calculated in UA vs GA4
| Metric | Universal Analytics (UA) | Google Analytics 4 (GA4) |
|---|---|---|
| Definition | A session where the user only viewed a single page and triggered only one request to the UA server. | A session that was not an "engaged session." |
| What triggers a bounce? | Leaving after viewing only one page, without any interaction events. | The session lasts less than 10 seconds, has no conversion event, and has only one pageview. |
| Core Concept | Measures single-page sessions. | Measures lack of engagement. |
| Main Drawback | Punished content that satisfied a user on a single page, leading to misleadingly high bounce rates. | The default 10-second timer might be too short for some sites, but it is adjustable. |
As you can see, GA4's model gives you a much clearer, more accurate picture of user behavior.
The image below helps visualize the difference between bounce rate and another commonly confused metric, exit rate.
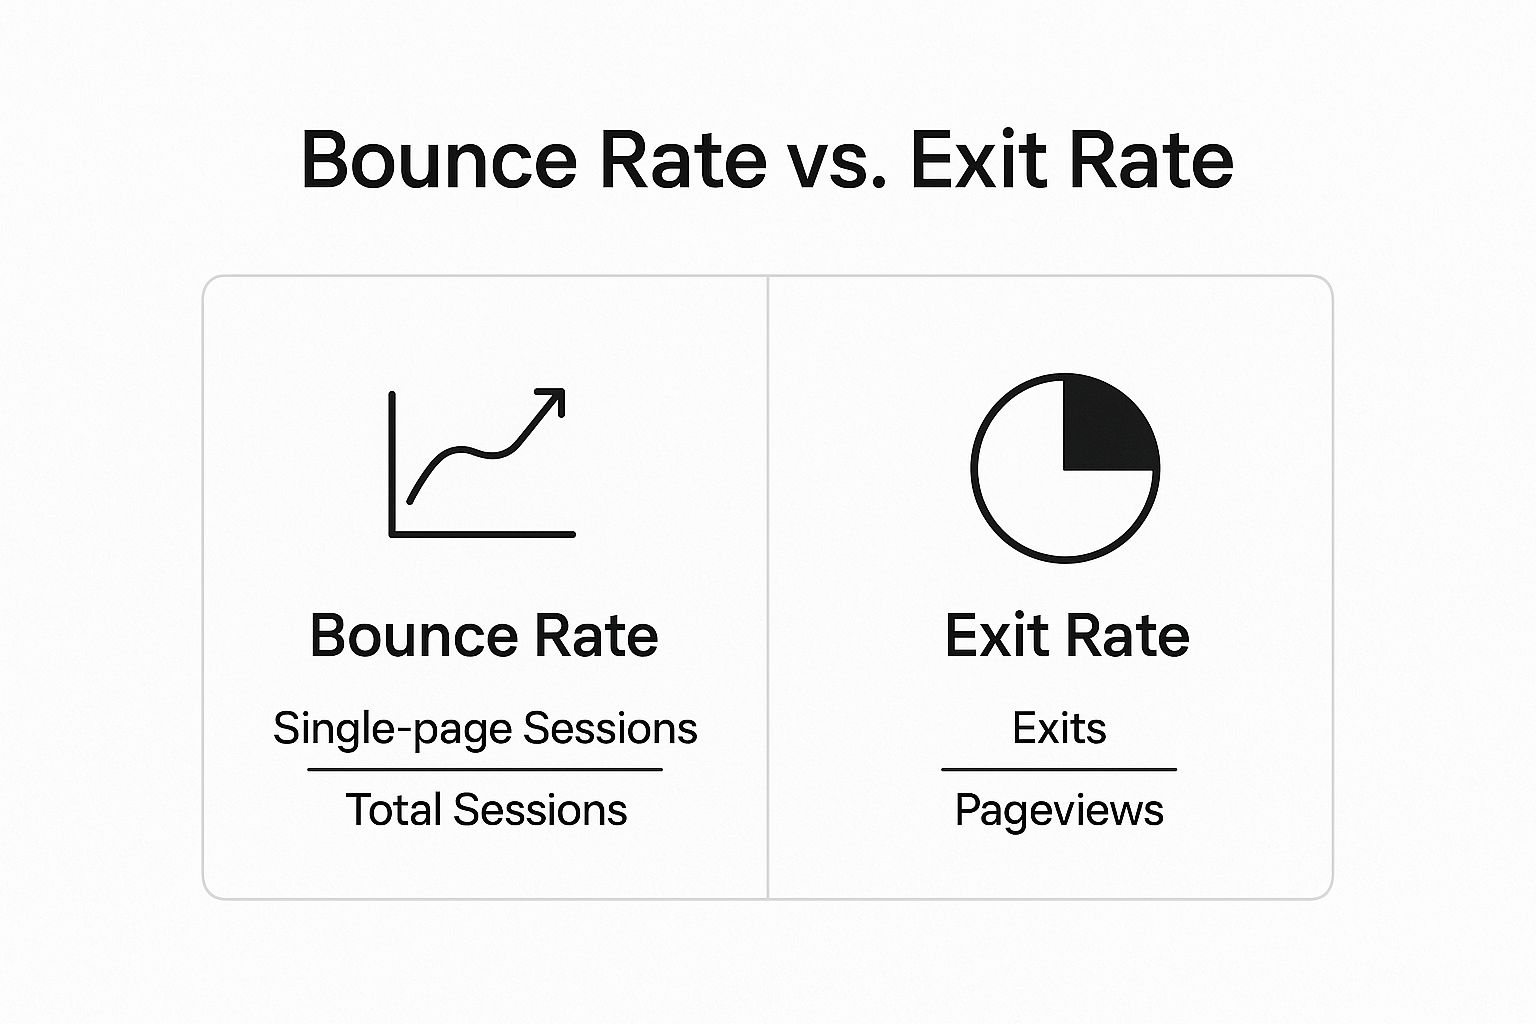
This visual helps clarify that a bounce is always a single-page session. An exit, on the other hand, is simply the last page someone views in any session, whether it had one page or twenty. Getting this distinction right is crucial for understanding your analytics, and GA4's focus on engagement helps bring that clarity.
Why Monitoring Bounce Rate Is Still Essential

Even with the smarter calculation in Google Analytics 4, the bounce rate in google analytics is still a fantastic diagnostic tool. It's no longer just about someone visiting one page and leaving. Now, a high bounce rate is a clear early warning that something’s off with your site’s health.
Think of it like a smoke detector for your user experience. When that number starts creeping up, it’s signaling that visitors aren't engaging the way you'd hope. This isn't just some abstract figure on a dashboard; it points to real problems that could be costing you leads, sales, and trust.
A high bounce rate is the clue that makes you stop and ask the right questions. Is my page delivering on its promise? Is it meeting user expectations? It’s often the first thread you pull to unravel much bigger issues.
What a High Bounce Rate Can Reveal
A sudden spike or a stubbornly high bounce rate can point to a whole host of underlying problems. It's rarely just one thing. Usually, it's a mix of factors that add up to a poor first impression, convincing a user to leave without taking any meaningful action.
Here are some of the most common culprits a high bounce rate helps you sniff out:
- Slow Page Speeds: People are impatient. If your page takes too long to load, they're gone before your content even has a chance to appear. These days, users expect pages to load in under 2.5 seconds.
- Poor User Experience (UX): Is your navigation confusing? Are you blasting visitors with annoying pop-ups? A design that isn’t mobile-friendly will absolutely frustrate users and send them running for the "back" button.
- Misaligned Ad Copy: This is a big one. Your ads might be writing checks that your landing page can't cash, leading to instant disappointment and a quick exit.
- Technical Glitches: Nothing kills engagement faster than a broken link, an image that won't load, or a contact form that throws an error.
By monitoring your bounce rate, you’re not just tracking a metric; you're actively looking for opportunities to improve the user journey and fix issues before they have a larger impact on your business goals.
A Practical Example of Bounce Rate in Action
Let's walk through a real-world scenario. Imagine you just launched a new ad campaign driving traffic to a shiny new landing page. A week later, you pop into Google Analytics and see the bounce rate for that page has shot up from a respectable 40% to a scary 75%.
That’s a huge red flag. Instead of just shrugging your shoulders, you can use this data to start investigating. Is the ad targeting the right people? Does the ad's message perfectly match what's on the landing page? A quick look reveals the ad promises a 50% discount, but the landing page only talks about a free trial.
Bingo. That disconnect is almost certainly the source of your bounces. By fixing the ad or updating the page, you bring expectations back in line, boost engagement, and make your entire campaign more effective. This is just one way keeping an eye on this metric can lead to direct, meaningful improvements.
To get an even clearer picture, you can learn more about click tracking setup with Google Analytics 4. This helps you understand exactly what users are interacting with before they decide to stick around or leave.
How to Interpret Your Bounce Rate Correctly
One of the biggest mistakes I see people make is getting fixated on a universal "good" bounce rate. Let me be clear: there’s no magic number. A healthy bounce rate in google analytics is all about context. To really get it right, you have to look past that single metric and see the whole story.
For example, a high bounce rate isn't automatically a red flag. Think about it. A visitor lands on your blog, finds the perfect answer to their question in 30 seconds, and leaves happy. That’s a win! Even though it counts as a bounce, your content did its job beautifully. The real goal isn't just to lower a number; it's to understand what that number is telling you about what your visitors want and how well your pages are delivering.
Context Is Everything
To make any sense of your bounce rate, you absolutely have to segment your data. Different pages, traffic sources, and devices will naturally have completely different performance baselines. If you lump everything together, you just end up with a useless average.
Start by asking a few simple questions:
- What's the job of this page? Your homepage should probably have a lower bounce rate than a blog post. A "Contact Us" page might have a high bounce rate because people find your phone number and leave to call you—which is exactly what you want them to do.
- Where did this traffic come from? Visitors arriving from a super-targeted email newsletter will almost always be more engaged (and have a lower bounce rate) than someone who clicked a general ad on social media.
- What device are they on? If you see a sky-high bounce rate just for mobile users, that’s a huge clue that you might have a problem with your responsive design or slow page loads on phones.
A "good" bounce rate is one that lines up with the goal of the page. Stop comparing your entire site to one benchmark. Instead, compare your landing pages to other landing pages, and your blog posts to other blog posts.
Benchmarking Against Industry Averages
While your own site’s context is what matters most, it can be helpful to peek at industry benchmarks. They give you a rough idea of whether you’re in the right ballpark compared to similar websites. Now that GA4 focuses on engagement, these benchmarks are more useful than ever.
Here's a quick look at some typical benchmarks to give you a starting point.
GA4 Engagement and Bounce Rate Benchmarks by Website Type
| Website Type | Typical Engagement Rate | Typical Bounce Rate |
|---|---|---|
| eCommerce | 55% – 75% | 25% – 45% |
| B2B / Lead Generation | 60% – 80% | 20% – 40% |
| Content / Blog | 20% – 50% | 50% – 80% |
| Landing Page | 15% – 40% | 60% – 85% |
| SaaS | 50% – 70% | 30% – 50% |
As you can see, the numbers are all over the place depending on the site's purpose. Recent data shows B2B and lead-gen sites often have lower bounce rates (around 20-40%), while content-heavy sites can see rates closer to 50-80%. You can dig deeper into these trends and see how GA4 is changing the game by checking out these GA4 bounce rate benchmarks on digitalocus.com.
Ultimately, the most important comparison you can make is against your own historical data. A sudden spike in your bounce rate is the real signal you need to pay attention to. It tells you something’s changed, and it’s time to investigate.
Proven Strategies to Improve User Engagement

Knowing your bounce rate in google analytics is one thing, but actually doing something about it is where the magic happens. When you work to lower your bounce rate, you’re really just boosting user engagement. It’s all about creating an experience that’s so good, so helpful, that visitors naturally want to stick around and see what else you have to offer.
This isn’t about using gimmicks to keep people on the page. It’s about delivering real value the moment they arrive. Think of these strategies as your game plan for turning quick exits into meaningful visits.
Supercharge Your Page Load Speed
In our instant-gratification world, speed isn't just a feature; it's a requirement. A slow-loading page is one of the top reasons people bounce. If a visitor has to wait more than a few seconds, they're gone—often before they even see what you've created.
Your goal should be to get your page’s main content loaded in under 2.5 seconds. Here’s how you can get there:
- Compress Your Images: Giant, unoptimized image files are a classic speed killer. Use tools to shrink them down without making them look grainy.
- Minimize Your Code: Every extra line of CSS, JavaScript, or HTML adds to the load time. A little spring cleaning can make a big difference.
- Use a Content Delivery Network (CDN): A CDN basically puts copies of your site on servers all over the globe, so content loads faster for users no matter where they are.
Enhance Content Readability
Okay, so your page loaded fast. Now what? If a visitor is greeted by a giant wall of text, their next click will be the back button. People don't read online; they scan. Your job is to make that scanning process as easy and inviting as possible.
Think of good formatting as the welcome mat for your content. It makes the page feel approachable and easy to digest, encouraging users to stay and read.
Break up your content so it’s easy on the eyes. It's not hard to do:
- Short Paragraphs: Stick to 2-3 sentences per paragraph. Seriously.
- Clear Headings: Use H2s and H3s to guide readers through the content.
- Bulleted and Numbered Lists: They are perfect for highlighting key points, features, or steps.
- Bold Text: Make important concepts pop so they catch the reader’s eye.
Provide a Clear Path Forward
Sometimes, a user bounces simply because they don’t know what to do next. Every page needs a purpose and should gently nudge the visitor toward another logical step. This is where smart internal linking and clear calls-to-action (CTAs) are crucial.
For instance, if someone is reading a blog post on website design, why not link them to a relevant case study or your services page? This keeps them moving through your site, and each click gets them more invested. Creating that clear journey is fundamental to site management and a big part of our broader list of conversion optimization tips.
Ultimately, a lower bounce rate is a fantastic stepping stone to the real prize: a website that converts. When you put these ideas into practice, you can improve website conversion rates and build a site that truly works for your business. You're not just tweaking a metric; you're creating a better experience for your audience.
Looking Beyond Bounce Rate to See the Full Picture
Relying only on your bounce rate in Google Analytics is a bit like judging a movie by its first scene. It gives you a hint of what's to come, but it definitely doesn't tell you the whole story. To really get a feel for how people are using your website, you need to look at a handful of metrics together.
Sure, a low bounce rate is great. But what if people are sticking around for minutes and not actually doing anything? That’s where other key metrics in Google Analytics 4 come into the picture. They provide the missing context, helping you move past just spotting problems to truly understanding what your visitors are up to.
Building a Complete Performance Dashboard
Think of your analytics dashboard as a team of experts. Bounce rate is the scout—it points out potential trouble. But you need the rest of the team to give you a full diagnosis. To get that complete view, bounce rate needs to be part of a comprehensive approach to B2B marketing analytics.
Here are a few essential metrics to check right alongside your bounce rate:
-
Average Engagement Time: This tells you how long your page is actually keeping someone’s attention. A low bounce rate combined with a high engagement time? That's a fantastic signal that your content is hitting the mark.
-
Conversions: This is the bottom line. Are people filling out your forms, signing up for your newsletter, or buying your products? A page might have a high bounce rate but still convert well if it gives users exactly what they need right away.
-
User Stickiness: This GA4 metric reveals how often people come back. It’s the difference between building a loyal audience and just getting a stream of one-time visitors.
By looking at these data points together, you start to build a story. You can see not just that users are leaving, but begin to understand why they might be staying or what they do right before they decide to go.
At the end of the day, bounce rate is just one piece of a much larger puzzle. When you pair it with metrics like engagement time and conversions, you unlock a far richer, more practical understanding of how your site is performing. This complete picture is what allows you to make smart, data-backed decisions that actually drive growth.
Frequently Asked Questions
Now that we've dug into the nuts and bolts of bounce rate, let's tackle some of the common questions that pop up when you start applying this knowledge.
Where Do I Find the Bounce Rate in GA4?
You might have noticed that bounce rate isn't front-and-center in most standard Google Analytics 4 reports. That's by design. GA4 prefers to highlight its inverse metric, Engagement Rate, which you'll see everywhere.
But don't worry, bounce rate is still there—you just have to add it yourself. It's a simple process of customizing a report.
Let’s use the 'Pages and screens' report as an example:
- First, navigate to the report you want to see bounce rate in.
- Find and click the little pencil icon in the top-right corner to Customize report.
- Click on Metrics, then Add metric.
- Just type "Bounce rate" into the search bar, select it, and hit apply. Done!
Is a High Bounce Rate Always a Bad Thing?
Not at all. This is probably the biggest misconception out there. Context is everything. In some cases, a high bounce rate is actually a good sign.
Think about it: a visitor lands on your blog post looking for a specific answer. They find it immediately, feel satisfied, and leave. That’s a win for them and for you.
Another great example is a "Contact Us" page. If someone bounces, it could mean they found your phone number and closed the tab to call you. That’s a successful conversion!
A high bounce rate only becomes a red flag when the page's goal is to encourage further exploration. For pages meant to provide quick info, a high bounce is completely fine.
How Does Bounce Rate Affect My SEO Rankings?
This is a tricky one. Google has been clear that bounce rate is not a direct ranking factor. They don't look at your GA bounce rate and decide to move you up or down.
However, it can be an indirect signal about your site's quality and relevance.
If a ton of people click on your page from a search result and then immediately bounce back to Google (this is sometimes called "pogo-sticking"), it tells the search engine that your page wasn't a good match for that query. If that happens enough, it could eventually impact your rankings. So, while it's not a direct cause, focusing on user engagement is always a good move for your SEO.
At OneNine, we live and breathe this stuff. We help businesses turn confusing analytics into clear, actionable strategies that make websites better. If you’re looking to create an experience that keeps visitors hooked, we’d love to chat. Find out how we can support your website.


