

At its most basic, calculating your marketing ROI is pretty straightforward. You just subtract your marketing costs from the revenue you brought in, divide that by the costs, and multiply by 100. The result is a simple percentage that tells you how profitable your campaigns really are.
Think of it as the ultimate scorecard for your marketing budget.
Laying the Groundwork for a Real ROI Number
Before you even touch a calculator, you need to get your house in order. If you jump straight into the ROI formula without clear goals and a full tally of your costs, you’ll end up with a number that looks good but doesn’t mean anything. The point isn't just to get an answer; it's to get the right answer that helps you make smarter decisions.
An accurate calculation starts with specific, measurable goals. A vague target like "get more leads" won't cut it. You need something concrete, like "increase qualified sales leads by 15% in Q3." This kind of clarity makes success easy to measure and links your marketing work directly to business results. A solid digital marketing strategy template can really help you map this out effectively. Find a good one here: https://onenine.com/ultimate-digital-marketing-strategy-template/
Tallying Up Your True Marketing Spend
Next, you have to track down every single dollar you spent on the campaign. This is where a lot of people go wrong—they only count the obvious stuff like ad spend. A true cost analysis digs much deeper.
You need to include:
- Software and Tools: Don't forget the subscription fees for your CRM, email platform, analytics dashboards, and any social media schedulers.
- Content Creation: What did you pay freelance writers, graphic designers, or video editors? Any agency fees go here, too.
- Team Hours: This is the one most people miss. Calculate the time your team spent on the campaign and multiply it by their hourly rate.
- Ad Spend: This is the easy one—the money you paid directly to platforms like Google, Meta, or LinkedIn.
Getting a complete picture of your expenses is essential for an honest ROI calculation. It's also why models like performance-based advertising are so interesting, as they build the cost-to-result connection right into the model.
The classic formula for marketing ROI is: ((Revenue from Marketing – Marketing Costs) / Marketing Costs) × 100. For example, if a campaign costs $100,000 and brings in $400,000 in revenue, the ROI is 300%. That’s a clear $3 return for every $1 you spent.
The whole process is a cycle. You collect data, analyze it, and then feed those insights right back into your next campaign plan, as you can see below.

This loop shows just how important those initial steps are. When you nail down your objectives and costs from the start, you can be confident that the final ROI figure is a true measure of your campaign's profitability, not just a vanity metric.
Gathering the Right Data Without the Headache
Okay, so you've nailed down your objectives. Now comes the part where many marketers get bogged down: rounding up the raw data for your calculation. The goal here is to avoid drowning in a sea of disconnected spreadsheets and dashboards.
We need to build a clean, simple dataset that directly connects your spending to your earnings. It sounds more complicated than it is, as long as you know where to look.
First things first, you need to track down your revenue data. If you’re running an e-commerce store, this is usually pretty simple—your sales are tracked right inside platforms like Shopify or WooCommerce. For B2B businesses, this information typically lives in your CRM. Your job is to pull the total revenue from deals that closed during the campaign's timeframe.
The real trick is tying that revenue back to a specific marketing effort. This is called attribution, and it's all about giving credit where it's due. Did that new customer find you through a Google Ad, a LinkedIn post, or your email newsletter? Answering that question is the key to an honest ROI calculation.
Connecting Actions to Revenue
Without proper tracking, you're just guessing. This is why having tools like Google Analytics set up correctly isn't just a suggestion—it's essential. If you haven't already, you need to learn how to set up Google Analytics conversion tracking. This is how you’ll see which channels are actually driving valuable actions on your site.
For starters, simple attribution models work just fine:
- First-Touch Attribution: This model gives 100% of the credit to the very first interaction a customer had with you. It’s fantastic for figuring out which channels are best at generating initial awareness.
- Last-Touch Attribution: In contrast, this one gives all the credit to the final touchpoint before a conversion. This helps you identify what’s effectively closing deals.
While these single-touch models are easy to implement, they don’t tell the whole story. A customer’s journey is rarely a straight line; it often involves multiple touchpoints across different channels over several weeks. A more blended, multi-touch approach usually gives you a truer picture of what’s influencing a sale.
Remember, the quality of your data directly impacts the quality of your ROI calculation. Garbage in, garbage out. Take the time to make sure your numbers are accurate and that you’re tracking conversions from the first touch to the final sale.
Before you start plugging numbers into a formula, it helps to have a clear checklist of what you need. Think of it as your recipe for an accurate ROI calculation.
Essential Data Points for ROI Calculation
| Data Point | Description | Common Source(s) |
|---|---|---|
| Total Revenue | The gross income generated from sales attributed to the marketing campaign. | CRM (e.g., Salesforce), E-commerce Platform (e.g., Shopify), Payment Processor (e.g., Stripe) |
| Marketing Campaign Cost | The total direct spend on the campaign (e.g., ad spend, content creation, software). | Ad Platforms (Google Ads, Meta Ads), Invoices, Accounting Software |
| Overhead Costs | A portion of indirect costs like salaries, agency fees, or software subscriptions. | Accounting Software (e.g., QuickBooks), Payroll Records |
| Lead Volume | The total number of new leads generated by the campaign. | CRM, Google Analytics, Landing Page Software (e.g., Unbounce) |
| Conversion Rate | The percentage of visitors or leads who completed a desired action (e.g., purchase, form submission). | Google Analytics, CRM, Marketing Automation Platform (e.g., HubSpot) |
| Customer Acquisition Cost (CAC) | The average cost to acquire a new customer through the campaign. | Calculated (Total Campaign Cost / New Customers) |
Having these data points organized will make the actual calculation much smoother and far more reliable.
This simple visual breaks down the core components you'll need for the basic ROI formula.
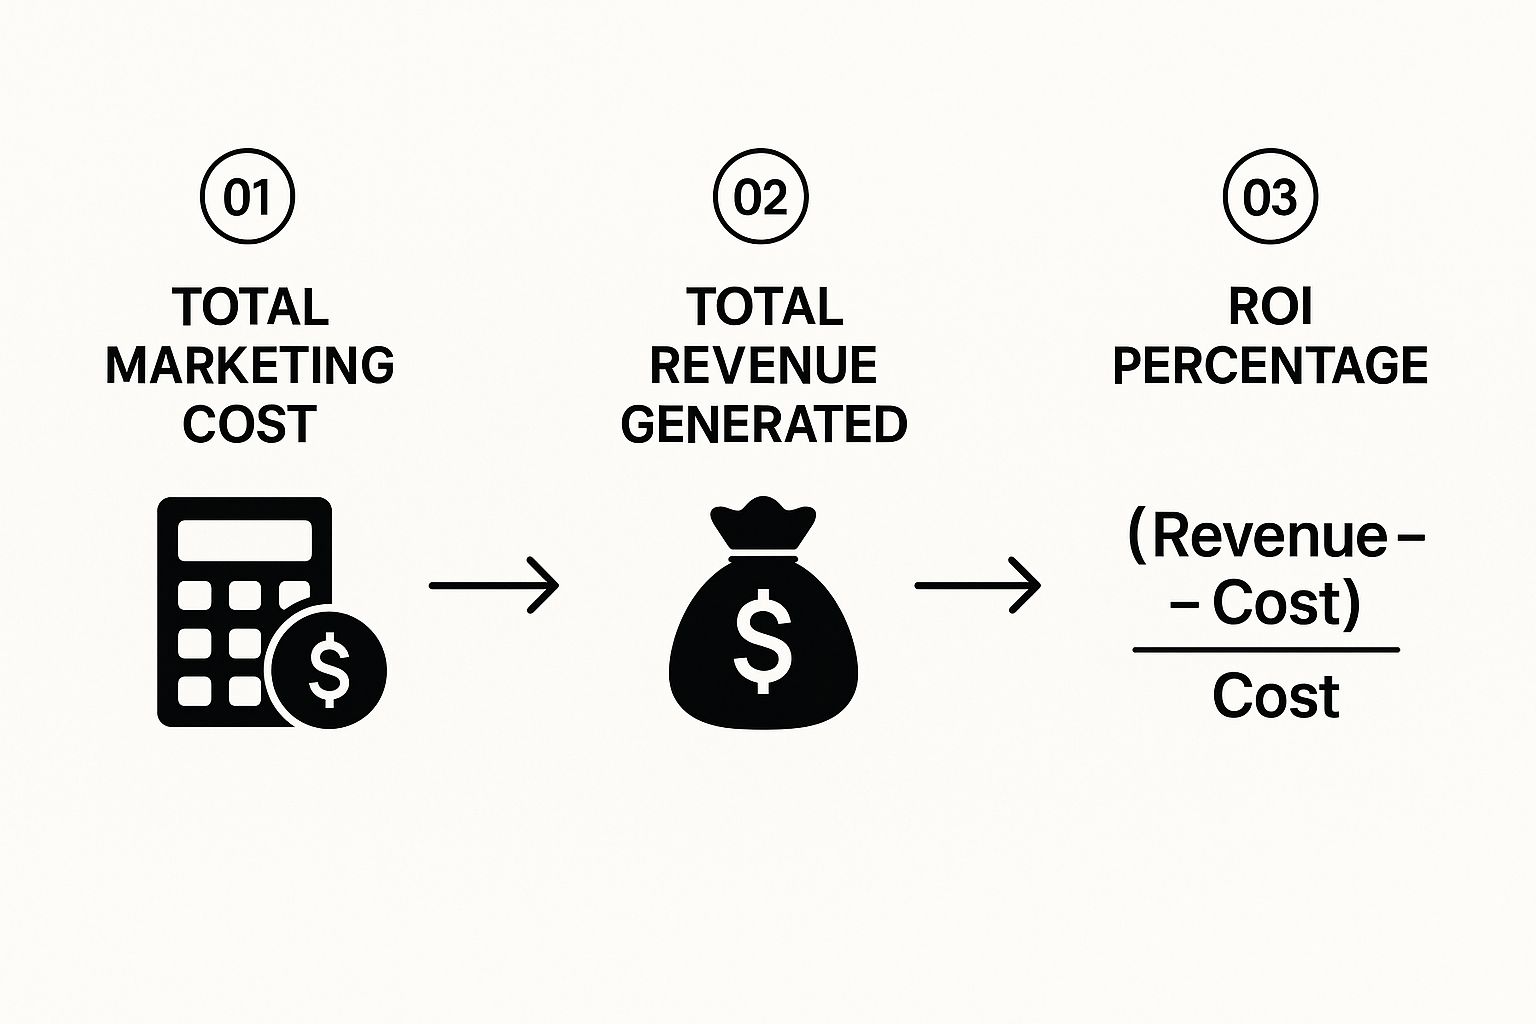
As you can see, the process flows logically from gathering your total costs and the revenue you generated to applying the formula. This ensures your final percentage is a solid indicator of profitability, giving you confidence in the numbers you present.
With these clean data points in hand, you’re ready for the fun part: plugging them into the formula.
Choosing the Right ROI Formula for Your Business

The standard ROI formula is a fantastic starting point, but let’s be honest—it rarely tells the whole story. Your specific business model, the length of your sales cycle, and what you’re ultimately trying to achieve all call for a more nuanced approach. To get a real grip on your returns, you need to calculate marketing ROI that drives profit in a way that goes beyond the simplest metrics.
Think about it. A fast-moving e-commerce store can often draw a straight line from an ad click to a sale that happened minutes later. Easy enough. But what about a B2B software company with a six-month sales cycle? The ad that brought in a lead today won't show any "return" for two quarters, making the basic formula feel pretty useless for day-to-day decisions.
Measuring B2B Pipeline Growth
If you're in a business with a long, complex sales cycle, you can't afford to wait for a deal to close before you know if your marketing is working. You need to prove your value much, much earlier. This is exactly where pipeline ROI comes into play.
Instead of focusing on closed-won revenue, pipeline ROI measures the value of the sales opportunities your marketing efforts create. This simple shift in perspective allows you to gauge campaign effectiveness almost immediately, long before any contracts get signed.
For example, say a marketing investment of $20,000 generates $180,000 in new, qualified sales opportunities. That’s a pipeline ROI of a whopping 800%. This figure tells your leadership team that marketing is successfully filling the pipeline with high-value prospects—a clear leading indicator of future revenue.
Focusing on Long-Term Profitability with LTV to CAC
Quick wins are great, but sustainable growth is built on long-term profitability. This is non-negotiable for subscription-based businesses like SaaS companies or any brand that depends on repeat customers. The gold-standard metric here is the Customer Lifetime Value (LTV) to Customer Acquisition Cost (CAC) ratio.
Here’s a quick rundown of what these terms mean:
- Customer Lifetime Value (LTV): This is the total revenue you can reasonably expect from a single customer throughout their entire relationship with your brand.
- Customer Acquisition Cost (CAC): This is the total sales and marketing spend required to land one new customer.
The magic number you're looking for is an LTV:CAC ratio of 3:1 or higher. In plain English, for every dollar you spend to get a customer, you should be getting at least three dollars back over their lifetime. If your ratio is dipping below that, it might be a sign you're overspending on acquisition or, just as likely, that you have a customer retention problem.
A strong LTV:CAC ratio is more than just a vanity metric; it’s a powerful signal of a healthy, scalable business model. It proves your marketing isn't just generating one-off sales but is attracting profitable customers who stick around for the long haul.
Let's put this into a real-world scenario. Imagine a SaaS company spends $5,000 on a campaign that brings in 10 new customers. Their CAC is $500 per customer. If the average customer pays $100 a month and stays for two years, their LTV is $2,400. This gives them an LTV:CAC ratio of nearly 5:1—a clear sign of a highly efficient and profitable marketing engine.
Ultimately, the right formula depends on what you need to know right now. Are you trying to justify last month's ad spend? Demonstrate how you’re building a healthy sales pipeline? Or prove the long-term viability of your business model? Using a combination of these calculations will give you the clearest, most complete picture of your marketing's true impact.
How to Interpret Your Results and Set Benchmarks
So, you’ve run the numbers and you have your marketing ROI. Great! But what does that number actually mean?
Getting a 300% ROI might feel like a huge win, but without context, it's just a number floating in space. Is that good for your industry? For that specific marketing channel? Figuring out how to read the story behind the number is just as critical as the calculation itself.
First thing’s first: stop comparing apples to oranges. A six-month content marketing play is designed to build long-term authority and organic traffic. A two-week PPC campaign is all about getting quick conversions. They have completely different goals and timelines, so their ROI will naturally look different.
Finding Your Baseline
To give your ROI meaning, you need a benchmark. Think of it as your yardstick for success. This can be based on your own past performance (internal) or what’s typical for your industry (external).
The best place to start is with your own history. What was the ROI for a similar campaign you ran last quarter? Or last year? This internal benchmark is your most reliable guide because it’s tailored to your business, your audience, and your market. It shows you if you're getting better over time.
Once you have that, you can start looking outward. Industry data can provide a helpful reality check.
Marketing Channel ROI Benchmarks
It’s easy to get caught up in a single ROI figure, but performance varies wildly from one channel to another. A "good" ROI for email is going to look very different from a good ROI for a trade show. The table below gives you a general idea of what to expect from different channels.
| Marketing Channel | Average Expected ROI (Ratio) | Key Considerations |
|---|---|---|
| Email Marketing | 36:1 – 40:1 | Highly dependent on list quality and engagement. Low cost can lead to high returns. |
| SEO | 22:1 | A long-term investment. Initial costs can be high, but returns compound over time. |
| Content Marketing | 3:1 (in leads vs. outbound) | Often measured in lead generation and brand authority, not just direct sales. |
| Google Ads (PPC) | 2:1 – 8:1 | Highly variable based on industry competition and ad spend. Offers immediate feedback. |
| Social Media | 3:1 | Can be difficult to attribute directly to sales. Great for brand awareness and engagement. |
Use these numbers as a rough guide, not as a strict rulebook. They help you understand if your performance is in the right ballpark, but your own historical data will always be the most important benchmark.
Your ROI figure isn’t a final grade—it's a diagnostic tool. A low ROI doesn't always mean a campaign failed; it might just mean the return is happening over a longer period or that you’re measuring the wrong thing.
By cross-referencing your results with your own history and these industry standards, you start to get a much clearer picture. Is your email marketing crushing the average? Is your paid social spend falling flat? These are the questions that lead to real, actionable insights.
Comparing ROI Across Different Channels
This is where the magic happens. Once you have reliable ROI data and benchmarks, you can start making much smarter decisions about where to put your money.
Let's imagine you're looking at your numbers. Your Google Ads campaign is delivering a 400% ROI, while your LinkedIn Ads campaign is at 150%. The obvious move is to pour more money into Google, right?
Not so fast. You need to look a little deeper before shifting your budget.
- What's the Customer Lifetime Value (LTV)? Are the customers you acquire from LinkedIn more valuable over the long haul, even if the initial return is lower? Maybe they have a higher retention rate or make larger purchases down the road.
- How long is the sales cycle? Perhaps the LinkedIn campaign is bringing in bigger, enterprise-level clients that just naturally take more time to close a deal. The ROI might look low now, but it could be massive in six months.
- Are you seeing the whole picture? Your attribution model might be giving Google all the credit for the final click, but is LinkedIn playing a key role in introducing your brand to those customers in the first place?
It's also important to apply this thinking to specific initiatives, not just broad channels. For instance, the process for how to measure ROI for event networking will be different than for a digital ad campaign. This level of detailed analysis helps you identify which efforts are truly driving growth and which are just draining your resources.
Using ROI Insights to Fuel Future Campaigns
Figuring out your marketing ROI isn't the finish line—it's more like the starting gun for the next race. The number you calculate is just a piece of data. The real magic happens when you turn that data into smarter, more profitable marketing decisions.
Think of your ROI analysis as a strategic roadmap. It clearly marks the superhighways that are working great and flags the bumpy backroads that are slowing you down. Your job is to redirect your budget toward the routes that actually get you where you want to go.
This isn't just about reporting on what happened. It’s a constant loop: you measure, you learn, you adjust, and then you measure all over again.
Pinpointing Areas for Improvement
When a campaign comes back with a disappointing ROI, the knee-jerk reaction is often to just scrap it. Hold on. Before you pull the plug, treat it as a valuable learning opportunity. Campaigns that aren't hitting the mark are actually perfect candidates for some targeted A/B testing.
Try to isolate different variables, one at a time, to find the weak link. You could test things like:
- Ad Copy: Are your headlines grabbing attention? Is your call to action compelling enough? Maybe a different tone would connect better.
- Audience Targeting: You might need to get more granular. Try refining your demographic, interest, or behavioral targeting to hone in on a more qualified audience.
- Landing Page Design: Small tweaks here can make a huge difference. Test the page layout, the number of form fields, or the main image to see what drives more conversions.
By systematically testing these elements, you can often transform a money-pit campaign into a profitable one. This kind of methodical approach is crucial for building a solid multi-channel marketing strategy, where what you learn on one channel can make another one even better.
Your ROI data isn't just a report card for past efforts; it's your cheat sheet for future success. It helps you ask better questions, like "Why did this work so well?" or "What can we test to fix this?" instead of just "What was the final number?"
Reallocating Your Budget with Confidence
Once you've identified your champions and your duds, it’s time to make some moves. This is the fastest way to boost your overall marketing ROI: confidently shift money away from campaigns that aren't cutting it and double down on the ones that are.
Let’s say your data shows that your SEO work is bringing in leads for a fraction of what your paid social ads cost. The decision is pretty clear, right? You’d reallocate a chunk of that social media budget into more content creation or technical SEO improvements.
This data-first approach takes the guesswork out of budgeting. It turns the process of figuring out how to calculate marketing ROI from a simple math problem into a powerful engine for real, sustainable growth.
Common Questions About Marketing ROI

Even after you’ve got the formulas down and your data is lined up, real-world questions always come up. It's one thing to understand the theory, but it's another to apply it to your unique situation.
Let's walk through some of the most common hurdles I see people face when they start calculating their marketing ROI. Getting these right is what separates a fuzzy guess from a truly useful analysis.
What Is a Good Marketing ROI?
This is easily the most popular question, and the honest answer is… it depends. There’s no magic number that works for everyone. What’s considered fantastic for one industry might be a total flop in another.
That said, people love a benchmark. A widely accepted rule of thumb is a 5:1 ratio. This means for every $1 you put into marketing, you get $5 back in revenue. Most businesses would be thrilled with that. An ROI of 2:1 is often just breaking even, especially after you account for the cost of producing your goods or services.
To get more specific, here’s what we often see across different channels:
- Email Marketing: This is frequently the champion of ROI, sometimes hitting an incredible 36:1 ratio or even higher. It’s all about that low cost and direct access to an engaged audience.
- Content Marketing: This is a long game. While it generates about 3x more leads than old-school marketing, its financial return takes time to build.
- Social Media Marketing: The average tends to hover around a 3:1 ratio, but this can swing wildly. Your results on a professional network like LinkedIn will look very different from a campaign on TikTok.
Ultimately, your best benchmark is your own past performance. The real goal is to consistently beat your own numbers.
How Long Should I Wait to Measure ROI?
This is where patience becomes your most valuable tool. The right time to measure ROI is completely tied to your sales cycle and the type of campaign you're running.
If you’re an e-commerce store running a weekend flash sale, you can probably get a clear read on your ROI within 24-48 hours. The journey from seeing an ad to making a purchase is incredibly short.
On the other hand, a B2B software company might have a six-month sales cycle. Measuring ROI after 30 days would be a waste of time—your leads are just getting started. For businesses like this, looking at pipeline ROI is a much smarter move for gauging early traction.
A classic mistake is pulling the plug too early on long-term plays like SEO and content marketing. These strategies need 6-12 months to mature and show a real financial return. They work by building authority and organic traffic, and that just doesn't happen overnight.
How Do I Handle Offline Conversions?
Things get messy when a customer starts online and finishes offline. Imagine someone sees your Instagram ad, clicks to your website, but then picks up the phone to place an order. How do you give that Instagram ad the credit it deserves?
This is a classic attribution problem, and the solution is to build a bridge between your digital marketing and your real-world sales.
One of the most effective tools for this is dynamic call tracking. It's a clever piece of tech that shows a unique phone number to visitors based on how they found you. When they call, the system automatically links that call—and the sale—back to the specific ad they came from. It closes the loop, giving you a far more accurate picture of what's actually driving your business.
At OneNine, we don't just build websites and run campaigns; we create digital strategies grounded in measurable results. If you're looking for a partner who can help you execute and prove the value of your marketing, we're ready to help. Discover how our services can drive your growth.


