

Unlocking Peak Website Performance: Essential Metrics for 2025
Want a high-performing website that drives results? You need to track the right website performance indicators. This listicle reveals eight essential metrics for 2025, covering everything from Core Web Vitals and page load time to conversion rate and uptime. Understanding these indicators is crucial for improving user experience, boosting conversions, and maximizing your online success. This list will empower you to identify areas for improvement and optimize your site's performance.
1. Core Web Vitals
Core Web Vitals are a set of three specific website performance indicators that Google considers crucial for measuring user experience. These metrics focus on loading performance, interactivity, and visual stability, providing a holistic view of how users perceive a website's performance. Introduced as official ranking factors in 2021, understanding and optimizing Core Web Vitals is essential for any website aiming for better visibility and user engagement. eCommerce businesses should pay close attention to key performance indicators (KPIs) that directly impact their bottom line. Tracking metrics like these and other ecommerce website performance metrics provides valuable insights into areas for improvement and growth. But why are Core Web Vitals so important, and what do they actually measure?
The three metrics that comprise Core Web Vitals are: Largest Contentful Paint (LCP), First Input Delay (FID), and Cumulative Layout Shift (CLS). LCP measures loading performance, essentially how long it takes for the largest element on the viewport (often an image or text block) to become visible. A good LCP score is 2.5 seconds or less. FID measures interactivity, quantifying the delay between a user's first interaction (like clicking a button or link) and the browser's response. An ideal FID is less than 100 milliseconds. Finally, CLS measures visual stability, looking at how much unexpected layout shifts occur during the page load. A CLS score of 0.1 or less is considered good.
Several successful implementations highlight the impact of optimizing for Core Web Vitals. CNN, for instance, improved their LCP by 50% by optimizing images and implementing a Content Delivery Network (CDN). Shopify stores, where visual consistency is paramount, often prioritize CLS improvements by ensuring proper image dimensions are specified. News websites, focused on providing a seamless reading experience, often concentrate on optimizing FID to minimize delays in user interaction.
The infographic below visualizes the relationships between Core Web Vitals and its three core metrics: LCP, FID, and CLS, along with their respective ideal performance thresholds.
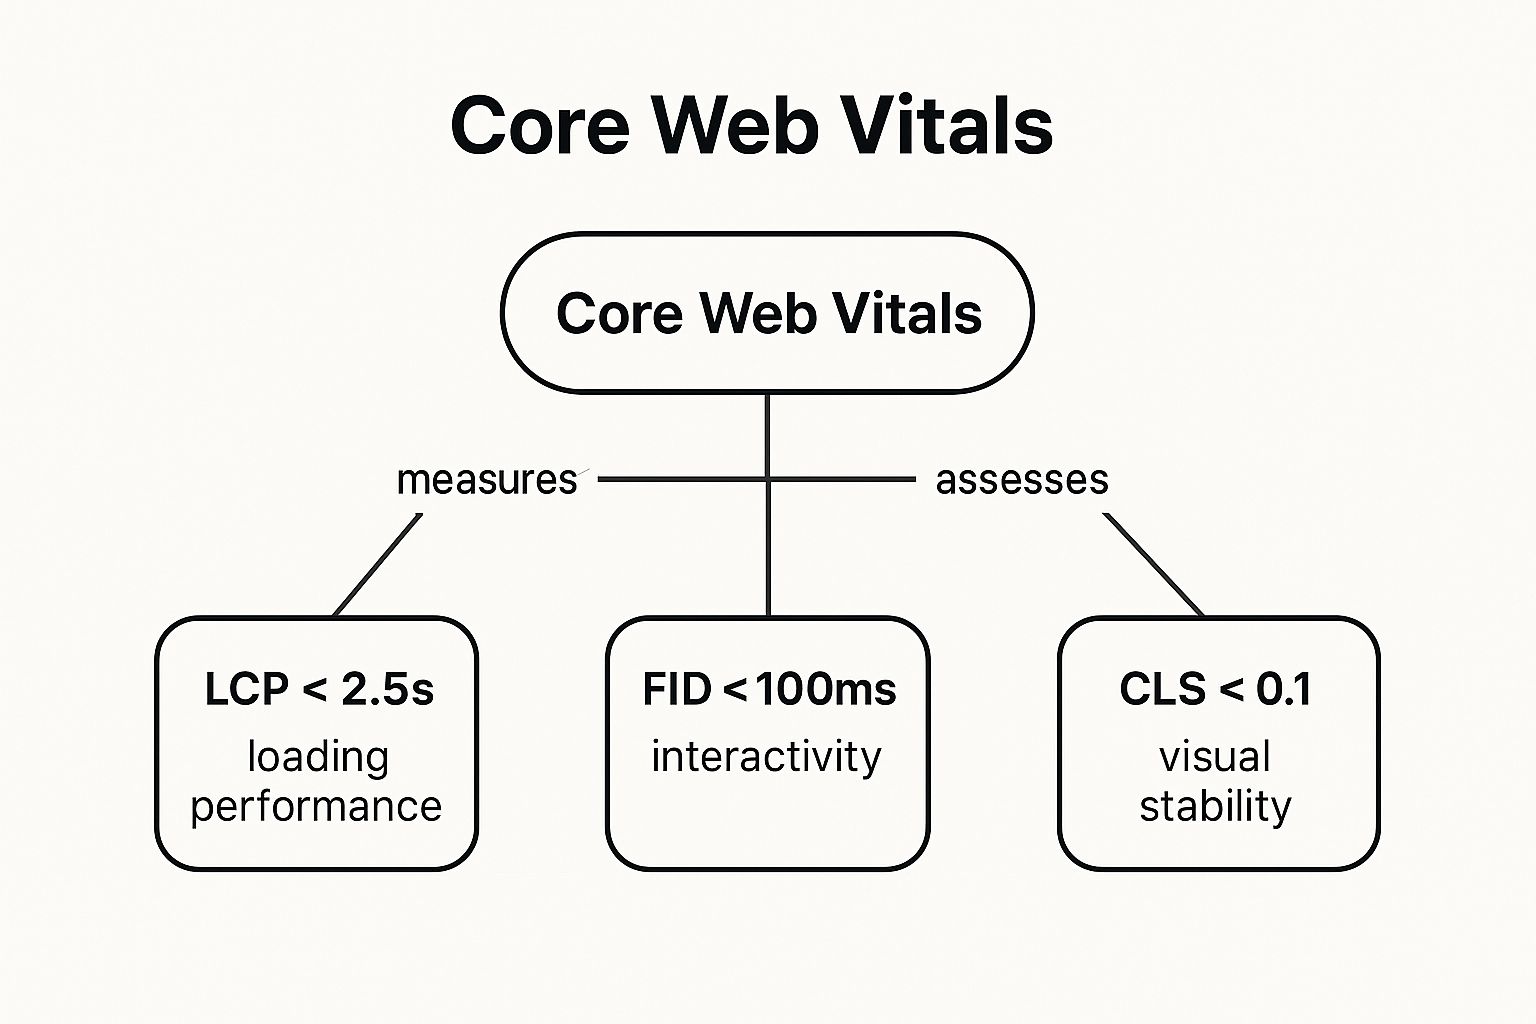
As the infographic illustrates, each metric contributes to the overall Core Web Vitals score, representing different facets of the user experience: loading speed (LCP), responsiveness (FID), and visual stability (CLS). Optimizing each of these individual metrics contributes to a positive overall Core Web Vitals score.
So, when and why should you focus on Core Web Vitals? These metrics have a direct impact on SEO rankings, as they are integrated into Google's search algorithm. Furthermore, they are user-centric, correlating with actual user experience, leading to higher engagement, lower bounce rates, and potentially increased conversions. The standardization of Core Web Vitals across the industry also provides a clear benchmark for performance optimization. Free tools like Google Search Console and PageSpeed Insights make measuring and tracking these metrics accessible to everyone.
While the benefits are clear, optimizing for Core Web Vitals can be complex. Addressing all three metrics simultaneously can require significant technical changes. The somewhat arbitrary thresholds for each metric also present a challenge.
Here are some actionable tips to improve your Core Web Vitals:
- Use Google PageSpeed Insights: This tool provides detailed analysis and recommendations for improving your website's performance.
- Optimize Images and Implement Lazy Loading: Compressing images and using lazy loading techniques can significantly improve LCP.
- Minimize JavaScript Execution Time: Reducing the amount and complexity of JavaScript can lead to better FID scores.
- Reserve Space for Dynamic Content: Pre-allocating space for elements that load asynchronously, like ads or images, can minimize CLS.
Learn more about Core Web Vitals to delve deeper into these crucial website performance indicators and unlock their full potential for your website. By focusing on these metrics, businesses can create a faster, more engaging, and ultimately more successful online presence.
2. Page Load Time
Page Load Time is a crucial website performance indicator that measures the total time it takes for a web page to completely load in a user's browser. This process begins from the initial request a user makes by clicking a link or typing in a URL and ends when all resources, including HTML, CSS, JavaScript, images, and other media, are fully rendered and displayed on the screen. It's a fundamental metric that directly impacts user experience, conversion rates, and search engine rankings. In today's fast-paced digital world, users expect websites to load quickly, and any delay can lead to frustration, abandonment, and ultimately, lost revenue.

Page Load Time offers a comprehensive view of your website's overall performance. It encompasses all aspects of the loading process, giving you a single, easily understood number to represent how quickly your site is delivered to users. This metric can be measured from different geographic locations, allowing you to understand performance variations based on user proximity to your servers. It also takes into account different device types and connection speeds, providing insights into how your website performs on desktops, mobile phones, and tablets, across various network conditions. Understanding these nuances is vital for optimizing the experience for all users, regardless of their location or device.
Several key features contribute to a thorough understanding of Page Load Time: it measures the complete rendering time, ensuring that the metric reflects the user's actual experience of a fully loaded page; it includes all resource loading, encompassing images, scripts, and stylesheets, not just the core HTML; and as mentioned earlier, it considers various geographical locations, device types, and connection speeds. These features provide a holistic perspective on page performance.
The benefits of monitoring Page Load Time are numerous. It's an easy metric to understand and communicate to stakeholders, making it a powerful tool for conveying the importance of web performance. It has a strong correlation with user satisfaction and conversions, as faster load times lead to happier users and increased engagement. Well-established benchmarks provide context for your performance and allow you to compare your site against competitors. However, there are also some drawbacks. Page Load Time can be influenced by external factors outside your control, such as the user's network conditions and device capabilities. It may not always accurately reflect perceived performance, as a page can sometimes appear interactive before all resources are fully loaded. Finally, as a single, aggregated metric, it doesn't pinpoint specific performance bottlenecks; further investigation is often required to identify the root cause of slow load times.
Many companies have seen significant improvements by focusing on Page Load Time. Amazon famously found that every 100ms of latency cost them 1% in sales. Pinterest reduced their perceived wait times by 40% and saw a 15% increase in search engine traffic and sign-ups. The BBC reported a 10% increase in user abandonment for every additional second of load time. These examples clearly demonstrate the impact of Page Load Time on business outcomes.
To improve your Page Load Time, strive for load times under 3 seconds for both desktop and mobile devices. Leverage Content Delivery Networks (CDNs) to distribute your content geographically closer to users, reducing latency. Optimize and compress images before uploading them to your website. Minimize HTTP requests by combining CSS and JavaScript files, and implement browser caching strategies to store frequently accessed resources locally on the user's device. These tactics can significantly improve your site's speed and user experience.
Page Load Time is a foundational metric for anyone concerned with website performance. Its importance has been championed by figures like Steve Souders, a former performance engineer at Google and Yahoo, and continues to be a central focus of the web performance optimization community. By understanding and optimizing this crucial indicator, businesses can improve user satisfaction, increase conversions, and gain a competitive edge in the online marketplace. It's a vital piece of the performance puzzle and deserves careful attention from SMBs, entrepreneurs, marketers, and business owners alike.
3. Time to First Byte (TTFB)
Time to First Byte (TTFB) is a crucial website performance indicator that measures the responsiveness of your server. Specifically, it measures the time elapsed between a user requesting a web page (clicking a link, typing a URL) and their browser receiving the very first byte of data from the server. Think of it as the time it takes for your server to start delivering content. While it might seem like a small detail, TTFB plays a significant role in overall user experience and search engine ranking. This metric is a critical component of understanding and optimizing your website's performance, ultimately impacting your bottom line.
How TTFB Works and Why It Matters
When a user requests a webpage, their browser sends an HTTP request to the server hosting the website. The server processes the request, gathers the necessary data, and then starts sending the webpage's content back to the browser. TTFB measures the duration of this process up to the point when the first byte of data arrives at the browser. This includes several steps:
- DNS Lookup: The browser resolves the domain name (e.g., www.example.com) to an IP address.
- Connection Establishment: The browser establishes a connection with the server at the resolved IP address.
- Server Processing: The server processes the request, which might involve database queries, dynamic content generation, or other server-side operations.
- First Byte Sent: The server sends the first byte of data back to the browser.
TTFB is independent of the overall size or complexity of the webpage content. It focuses solely on the initial server response. A low TTFB indicates a responsive server and efficient backend processes, leading to faster initial page rendering and a better user experience. A high TTFB, on the other hand, suggests potential bottlenecks in server performance, network latency, or other infrastructure issues.
Why TTFB Deserves Its Place on the List
TTFB directly impacts user experience. A slow TTFB can lead to a blank white screen for users, creating the impression of a slow-loading website. This can lead to frustration, increased bounce rates, and lost conversions. Furthermore, search engines like Google consider page speed a ranking factor, and TTFB is a key component of page speed. A fast TTFB contributes to improved search engine rankings, increasing your website's visibility and driving more organic traffic. For SMBs, entrepreneurs, marketers, and agency professionals, understanding and optimizing TTFB is essential for achieving online success.
Benefits and Drawbacks of Using TTFB
Pros:
- Excellent Indicator of Server Performance: TTFB pinpoints server-side bottlenecks, allowing for targeted optimization efforts.
- Helps Identify Backend Bottlenecks: It highlights issues with database queries, slow server-side code, or inefficient caching mechanisms.
- Easy to Measure and Track Consistently: Various tools, including browser developer tools and web performance monitoring platforms, make measuring TTFB straightforward.
- Good Predictor of Overall Page Performance: While not the sole indicator, TTFB often correlates with overall page load time.
Cons:
- Doesn't Reflect the Complete User Experience: TTFB only measures the initial server response and doesn't account for subsequent content loading.
- Can Be Affected by Geographic Distance to Server: Users located farther from the server will generally experience higher TTFB due to network latency.
- May Not Correlate with Perceived Performance: Other factors like front-end optimization and browser rendering can also influence user perception of speed.
Examples of Successful TTFB Optimization
- Cloudflare's Global CDN: Content Delivery Networks (CDNs) like Cloudflare drastically reduce TTFB by caching content closer to users geographically, minimizing latency. Cloudflare boasts TTFB under 100ms globally.
- WordPress Sites and Caching Plugins: WordPress sites often leverage caching plugins like WP Rocket to serve static content quickly, dramatically improving TTFB.
- E-commerce Sites and Server-Side Optimization: E-commerce platforms prioritize sub-200ms TTFB through server-side optimizations like efficient database queries and optimized code.
Actionable Tips for Improving TTFB
- Aim for TTFB under 200ms: This is a generally accepted benchmark for optimal performance.
- Use CDNs to Reduce Geographic Latency: CDNs distribute content across multiple servers globally, minimizing the distance to users.
- Optimize Database Queries and Server-Side Code: Ensure efficient database queries and streamline server-side code to minimize processing time.
- Implement Proper Caching Strategies: Cache static content like images, CSS, and JavaScript files to reduce server load and improve response times.
- Choose Hosting Providers with Good Server Performance: Select a hosting provider with a proven track record of fast and reliable server performance.
By understanding and optimizing TTFB, you can significantly improve your website's performance, leading to a better user experience, increased conversions, and improved search engine rankings. This metric is a powerful tool for businesses of all sizes, providing valuable insights into server responsiveness and opportunities for optimization.
4. Bounce Rate: A Key Website Performance Indicator
Bounce rate is a crucial website performance indicator that reveals how users interact with your website. It represents the percentage of visitors who land on a single page and then exit without interacting further or navigating to other pages within your site. While not solely a performance metric, bounce rate is closely tied to factors like page load speed and user experience, making it a valuable tool for assessing the effectiveness of your website. Understanding and optimizing your bounce rate can significantly impact user engagement, conversions, and overall website success. This is particularly important for SMBs, entrepreneurs, marketers, business owners, agencies, CEOs, CMOs, and heads of marketing seeking to maximize their online presence.
How Bounce Rate Works and What It Tells You
When a user visits your website and leaves after viewing only one page without triggering any other requests to the analytics server, it's counted as a bounce. This could involve anything from closing the browser window to clicking a link to an external website. Essentially, a high bounce rate suggests that a significant portion of your visitors aren't finding what they're looking for or are encountering issues that prevent them from exploring your website further.
Web analytics platforms like Google Analytics track bounce rate automatically, providing you with easily accessible data. This data is expressed as a percentage, with a higher percentage indicating a higher bounce rate. For instance, a bounce rate of 70% means that 70 out of every 100 visitors leave your site after viewing only one page.
Interpreting Bounce Rate in Context
It's crucial to understand that a high bounce rate isn't always a negative sign. The context of the page and its intended purpose play a significant role. For example, a single-purpose page, like a contact us page or a blog post providing a specific answer, might naturally have a higher bounce rate. The user finds the information they need and leaves, fulfilling their objective. This is where analyzing bounce rate within the context of website performance indicators becomes essential.
Consider these examples:
- News Websites: These sites often have bounce rates between 70-90% because users typically arrive from social media or search engines, read a single article, and then leave.
- E-commerce Sites: A good bounce rate for e-commerce sites typically falls between 20-45%. Lower bounce rates here suggest users are browsing multiple products and potentially adding items to their carts, indicating engagement and potential purchases.
- Blog Posts: While blog posts often have bounce rates in the 70-80% range, they can still be considered successful if they provide valuable information to the reader, even if the reader doesn't navigate further.
Why Bounce Rate Matters for Website Performance
Bounce rate provides valuable insights into user engagement and the overall effectiveness of your website. A consistently high bounce rate across multiple pages can signal underlying issues that need addressing. These issues can range from slow page load speeds to poor user experience, irrelevant content, or a lack of clear calls-to-action. By monitoring and analyzing bounce rate alongside other website performance indicators, you can identify areas for improvement and enhance your website's ability to achieve its goals, whether it's driving conversions, generating leads, or providing information.
Actionable Tips for Optimizing Bounce Rate
- Analyze Bounce Rate in Context: Understand the purpose of each page and set realistic bounce rate expectations accordingly. Don't panic about a high bounce rate on a single-purpose page if it's serving its function.
- Improve Page Load Speed: A slow-loading website is a major contributor to high bounce rates. Optimize images, leverage browser caching, and minimize HTTP requests to improve loading times.
- Enhance Content Relevance and User Experience: Ensure your content is relevant to the user's search query or the link they clicked. Provide a seamless and intuitive user experience with clear navigation and a mobile-friendly design.
- Use Clear Calls-to-Action: Guide users towards desired actions with compelling calls-to-action. Encourage them to explore other pages, sign up for a newsletter, or make a purchase.
- Monitor Mobile vs. Desktop Bounce Rate Differences: Analyze bounce rate separately for mobile and desktop users. Identify any discrepancies and optimize the user experience accordingly, considering the different browsing behaviors on each platform.
Pros and Cons of Using Bounce Rate as a Performance Indicator
Pros:
- Easy to understand and track
- Strong indicator of user engagement
- Available in most analytics platforms
- Correlates with conversion rates
Cons:
- Context-dependent (high bounce rate isn't always bad)
- Can be misleading for single-purpose pages
- Influenced by factors beyond performance
By understanding and strategically utilizing bounce rate as a website performance indicator, businesses can gain valuable insights into user behavior, identify areas for improvement, and ultimately create a more engaging and effective online presence. This leads to improved conversion rates, increased user satisfaction, and a stronger overall website performance.
5. Mobile Performance Score
Mobile Performance Score is a crucial website performance indicator that measures how effectively your website functions on mobile devices. It takes into account a range of factors, including loading speed, responsiveness, touch-friendliness, and other elements that contribute to a positive mobile user experience. In today's digital landscape, with mobile traffic accounting for over half of all web traffic globally, prioritizing mobile performance is no longer optional—it's a necessity for online success. A poor mobile experience can lead to high bounce rates, low conversion rates, and ultimately, lost revenue. Therefore, understanding and optimizing your Mobile Performance Score is essential for reaching and engaging your target audience effectively.

This metric provides a comprehensive assessment of the mobile user experience, going beyond just load times. It examines how well your website adapts to different screen sizes, whether touch targets are appropriately sized for easy interaction on smaller screens, and how well it performs under varying mobile network conditions. It also considers mobile-first indexing requirements, ensuring your website is structured to be easily crawled and indexed by search engines, which prioritize the mobile version of your site for ranking.
This comprehensive approach is what sets Mobile Performance Score apart from other, more narrow metrics. While page speed is undoubtedly important, it's only one piece of the puzzle. A website might load quickly but still offer a frustrating user experience due to tiny buttons, confusing navigation, or content that doesn't adapt well to smaller screens. Mobile Performance Score addresses all these aspects, providing a more holistic view of your website's mobile readiness.
There are numerous benefits to prioritizing and improving your Mobile Performance Score. First and foremost, it directly addresses the needs of the majority of web users – those accessing your site from their smartphones or tablets. By providing a seamless and enjoyable mobile experience, you increase user engagement, reduce bounce rates, and improve conversion rates. A higher Mobile Performance Score also directly impacts your mobile search rankings. Google and other search engines prioritize mobile-friendly websites, meaning a better score can translate to higher visibility in search results, driving more organic traffic to your site. Furthermore, analyzing your Mobile Performance Score helps identify specific areas for mobile optimization, providing actionable insights to enhance your website’s mobile-friendliness.
However, optimizing for mobile presents its own set of challenges. The sheer diversity of mobile devices, screen sizes, and operating systems makes it complex to ensure a consistent experience across all platforms. Optimizing for mobile often requires separate testing and optimization strategies compared to desktop versions, which can be time-consuming and resource-intensive. Sometimes, mobile optimization priorities can even conflict with desktop optimization, requiring careful balancing to achieve optimal performance on both.
Successful implementations of mobile optimization can be seen in various examples across the web. AMP (Accelerated Mobile Pages) implementations significantly boost mobile performance by stripping down websites to their essential elements, resulting in dramatically faster load times. Progressive Web Apps (PWAs) like Twitter Lite offer near-native mobile performance by leveraging caching and other techniques to deliver a smooth and engaging experience even on low-bandwidth connections. Responsive design frameworks like Bootstrap provide a solid foundation for building websites that adapt seamlessly to different screen sizes, ensuring a consistent and user-friendly experience across devices.
For SMBs, entrepreneurs, marketers, and business owners, there are several actionable tips to improve Mobile Performance Score. Start by using Google's Mobile-Friendly Test tool to assess your website's current performance and identify areas for improvement. Implementing responsive design principles ensures your website adapts to various screen sizes. Optimize images for mobile devices and retina displays to reduce file sizes without sacrificing quality. Minimize the use of pop-ups and interstitials, which can disrupt the mobile user experience. Finally, and most importantly, test your website on actual mobile devices, not just desktop simulations, to accurately gauge its performance in real-world scenarios.
The importance of Mobile Performance Score has been significantly amplified by Google’s mobile-first indexing initiative and the continuous advancements within the mobile web development community. These factors underscore the critical role mobile performance plays in online visibility, user engagement, and overall business success. Therefore, prioritizing mobile optimization and regularly monitoring your Mobile Performance Score are essential strategies for staying competitive in today's mobile-centric world.
6. Server Response Time: A Critical Website Performance Indicator
Server Response Time (SRT) is a crucial website performance indicator that measures how quickly your web server responds to a browser's request. It represents the time elapsed between the browser sending a request and the server beginning to send back data. This doesn't include the time it takes to download the entire content, render it, or execute JavaScript; it focuses solely on the server's processing efficiency. Understanding and optimizing SRT is fundamental to achieving a fast, responsive website and positive user experience, earning it a prominent place on the list of critical website performance indicators. For SMBs, entrepreneurs, marketers, agency professionals, and business leaders (CEOs, CMOs, Heads of Marketing), a fast SRT translates to improved user engagement, higher conversion rates, and better search engine rankings.
SRT directly impacts every other website performance metric. A slow server response creates a bottleneck, delaying content delivery, page rendering, and ultimately, the user's perception of your site's speed. This delay cascades through the entire user experience, leading to higher bounce rates and lost opportunities. Imagine a customer trying to purchase a product from your online store, only to be met with sluggish loading times; they are much more likely to abandon their cart and look elsewhere.
Server Response Time measures the pure backend performance of your website. It’s independent of factors like network speed, client-side processing, and content rendering on the user's device. This isolation makes it easier to pinpoint and address performance bottlenecks originating from your server infrastructure. This metric is affected by several factors, including server resources (CPU, memory, disk I/O), database performance (query efficiency, indexing), and code efficiency (optimized algorithms, efficient frameworks). It can also be measured for different types of requests. For example, serving static content like images should typically have a faster response time than processing complex dynamic content generated by database queries.
One of the significant advantages of focusing on SRT is its relative ease of isolation and optimization compared to other performance indicators. By analyzing server logs and performance monitoring tools, developers can pinpoint specific bottlenecks and implement targeted solutions. Further, optimizing SRT is a fundamental building block for overall site speed. Improving your server’s responsiveness lays the foundation for faster page load times and a more seamless user experience.
However, effectively optimizing Server Response Time often requires technical expertise. It may involve delving into server configurations, database optimization, and code refactoring. In some cases, significant improvements might necessitate infrastructure investment, such as upgrading to more powerful servers or implementing a content delivery network (CDN). External dependencies, like third-party APIs, can also impact SRT, adding another layer of complexity to optimization efforts.
Numerous examples highlight the benefits of a fast SRT. Netflix, known for its seamless streaming experience, has optimized its server response time to under 50ms for content recommendations, ensuring users receive quick suggestions. WordPress sites, a staple for many SMBs, frequently improve response time through caching plugins and optimized hosting solutions. In high-performance applications, API endpoints are often optimized for sub-100ms response times to ensure rapid data exchange.
So, how can you improve your website's Server Response Time? Aim for a server response time under 200ms as a general guideline. Learn more about Server Response Time to delve into specific strategies. Implement database query optimization techniques to reduce query execution time. Leverage server-side caching strategies to store frequently accessed data in memory, reducing the load on your database. Choose appropriate hosting solutions that can handle your website's traffic demands. Continuously monitor your server resource utilization (CPU, memory, disk I/O) to identify potential bottlenecks.
By understanding and optimizing Server Response Time, businesses can significantly improve their website's performance, user experience, and ultimately, their bottom line. This vital website performance indicator, popularized by web hosting companies and backend performance optimization specialists, is a key factor in creating a successful online presence. Investing time and resources in optimizing your SRT is an investment in your business's growth and success.
7. Conversion Rate
Conversion rate, a crucial website performance indicator, measures the percentage of visitors who complete a desired action on your website. These actions, often referred to as conversions, could range from making a purchase and signing up for a newsletter to downloading a resource or filling out a contact form. While primarily considered a business metric, conversion rate is deeply intertwined with website performance, making it a critical factor for anyone from SMBs and entrepreneurs to CEOs, CMOs, and marketing agencies. Even seemingly minor improvements in areas like page load time can significantly impact your bottom line by influencing how many visitors convert into customers or leads. This is why understanding and optimizing your conversion rate deserves a prominent place in your website performance strategy.
How does conversion rate work? It's calculated by dividing the number of conversions by the total number of website visitors and multiplying by 100 to express it as a percentage. For example, if your website had 10,000 visitors and 200 of them made a purchase, your conversion rate for purchases would be 2%. This seemingly simple metric provides powerful insights into the effectiveness of your website in achieving its business objectives.
The features that make conversion rate such a powerful indicator include its ability to directly measure goal completion percentage, its inherent tie to business outcomes and revenue, and its strong correlation with website performance. Moreover, you can track conversion rates for multiple goals simultaneously, allowing you to assess the effectiveness of different aspects of your website and marketing campaigns. You could, for instance, track conversion rates for newsletter sign-ups, ebook downloads, and product purchases all at the same time.
The benefits of focusing on conversion rate are clear. It offers a direct measurement of business impact, provides a clear ROI indicator for any performance improvements you implement, and allows you to easily communicate the value of those improvements to stakeholders. By integrating performance with business goals, conversion rate bridges the gap between technical improvements and tangible business results.
However, conversion rate is not without its limitations. It’s influenced by numerous factors beyond website performance, including marketing campaigns, pricing strategies, and overall market conditions. Furthermore, achieving statistical significance may require a substantial amount of website traffic, and conversion rates can fluctuate seasonally or due to external factors. These nuances make it crucial to analyze conversion rate trends over time and in conjunction with other website performance indicators.
Numerous examples highlight the direct relationship between website performance and conversion rate. Walmart, for instance, found that for every 1-second improvement in page load time, conversions increased by 2%. Similarly, Mobify saw a 1.11% increase in conversion for every 100ms decrease in homepage load time. AutoAnything, after reducing load time by 50%, experienced a significant 12-13% increase in sales. These case studies underscore the importance of optimizing website performance to drive conversions and revenue growth.
So, how can you effectively leverage conversion rate optimization for your website? Here are some actionable tips:
- A/B test performance improvements: Test different versions of your website elements (e.g., headlines, call-to-action buttons, page layout) to measure their impact on conversion rate.
- Prioritize high-value pages: Focus on optimizing high-traffic pages that contribute significantly to your business goals, such as product pages or landing pages.
- Monitor changes: Continuously monitor conversion rate changes after implementing any performance optimizations to assess their effectiveness.
- Consider the entire conversion funnel: Optimize the entire user journey, from the initial landing page to the final conversion, rather than focusing on individual pages in isolation.
- Track micro-conversions: Monitor smaller actions that lead to the final conversion, such as adding items to a cart or clicking a specific button. These micro-conversions provide valuable insights into user behavior and can help identify areas for improvement.
Learn more about Conversion Rate and explore strategies for maximizing your business growth through effective conversion rate optimization.
Popularized by e-commerce platforms like Shopify and WooCommerce, as well as conversion rate optimization (CRO) specialists, optimizing conversion rates has become a core focus for businesses seeking to maximize their online success. By understanding the relationship between website performance and conversion rate, and by implementing the tips outlined above, you can significantly improve your website's ability to drive desired actions and achieve your business objectives. Don't underestimate the power of a seemingly small percentage increase in conversion rate – it can translate into significant revenue growth and a substantial improvement to your bottom line.
8. Uptime/Availability
Uptime, often used interchangeably with availability, is a crucial website performance indicator that measures the percentage of time a website is accessible and operational for users. It's typically expressed as a percentage over a given period (e.g., daily, weekly, monthly, annually). Think of it as the heartbeat of your online presence; even the most beautifully designed, lightning-fast website is useless if it's inaccessible when potential customers try to reach it. For SMBs, entrepreneurs, marketers, and CEOs alike, uptime directly impacts brand reputation, customer trust, and ultimately, revenue. This is why it deserves a prominent place among key website performance indicators.
Uptime monitoring works by continuously sending requests to your website from various locations around the world. These monitoring services check if the server responds and if the website loads correctly. If a request fails or the website doesn’t load within a predefined timeframe, the service registers downtime. This information is then used to calculate the overall uptime percentage. Many services also offer detailed reports on downtime incidents, including the duration, cause, and potential impact.
Understanding and tracking uptime is fundamental because it forms the bedrock for all other website performance metrics. A website’s speed, user experience, and conversion rates are irrelevant if the site itself is down. For example, imagine launching a flash sale with optimized landing pages and targeted advertising, only to have your website crash due to server overload. All that effort and investment would be wasted due to poor uptime.
Here's why focusing on uptime/availability is crucial:
- Critical Foundation: All other performance metrics, such as page load speed and bounce rate, become meaningless if your website is unavailable. Uptime is the foundation upon which all other optimizations are built.
- User Trust and Brand Reputation: Downtime erodes user trust. Imagine a potential customer encountering an error message instead of your homepage. This negative experience can lead to lost sales and damage your brand's reputation.
- Direct Revenue Impact: For e-commerce businesses, every minute of downtime translates directly to lost revenue. This is especially critical during peak seasons and promotional campaigns.
- Easy to Understand and Communicate: Uptime is a straightforward metric that's easy to grasp and communicate across teams, from marketing to IT. This simplifies reporting and facilitates data-driven decision-making.
- Automated Monitoring and Alerts: Several tools and services provide continuous uptime monitoring and send alerts via email, SMS, or other channels when downtime occurs, allowing for swift intervention.
However, achieving and maintaining high uptime isn't without its challenges:
- Cost Factor: Implementing redundant systems, failover mechanisms, and robust infrastructure can be expensive, particularly for smaller businesses.
- Infrastructure Complexity: Managing a high-availability setup requires technical expertise and ongoing maintenance.
- External Factors: Despite best efforts, external factors like DDoS attacks or internet outages can impact uptime, highlighting the importance of robust incident response plans.
Examples of successful uptime implementation are readily visible across the web. Amazon Web Services (AWS), a leading cloud provider, commits to 99.99% uptime for many of its services. Similarly, Google’s search engine maintains incredibly high uptime, ensuring global accessibility. For highly sensitive sectors like financial services, uptime requirements can be even more stringent, often reaching "five nines" (99.999%) availability.
Here are some actionable tips to improve your website’s uptime:
- Utilize Multiple Monitoring Services: Employing several monitoring services from different geographic locations provides a comprehensive view of your website's availability and helps identify regional issues. Services like Pingdom and UptimeRobot are popular choices.
- Implement Redundancy: Invest in redundant servers and infrastructure to ensure that if one component fails, another can seamlessly take over, minimizing downtime.
- Develop Incident Response Procedures: Prepare a detailed plan outlining steps to be taken in case of downtime. This should include communication protocols, troubleshooting procedures, and escalation paths.
- Choose Reliable Hosting Providers: Select a hosting provider with a strong Service Level Agreement (SLA) that guarantees a specific uptime percentage.
- Monitor Third-Party Dependencies: Identify and monitor external services, such as payment gateways or APIs, that your website relies on, as their downtime can also impact your availability.
By prioritizing uptime and implementing these strategies, businesses of all sizes can establish a reliable online presence, build customer trust, and maximize their potential for success in the digital landscape. Don't let downtime be the bottleneck to your online growth; make uptime a core component of your website performance strategy.
Website Performance Metrics Comparison
| Performance Indicator | Implementation Complexity 🔄 | Resource Requirements ⚡ | Expected Outcomes 📊 | Ideal Use Cases 💡 | Key Advantages ⭐ |
|---|---|---|---|---|---|
| Core Web Vitals | Moderate – requires technical changes for multiple metrics | Medium – tooling available but may need developer effort | Improved SEO rankings and user experience | Websites aiming to enhance UX and SEO | Direct SEO impact, standardized metrics |
| Page Load Time | Low – easier to measure but optimization can be complex | Medium – requires optimization of multiple assets | Faster page rendering, better user satisfaction | Broadly applicable to all websites | Easy to understand, strong user impact |
| Time to First Byte (TTFB) | Low to Moderate – focuses on backend/server optimizations | Low to Medium – mostly server and network improvements | Faster server response, better initial load time | Backend performance tuning and server optimization | Good backend health indicator, easy to track |
| Bounce Rate | Low – tracked via analytics platforms | Low – no direct resource consumption | Insights into user engagement and content relevance | Marketing analysis, UX evaluation | Easy to track, correlates with engagement |
| Mobile Performance Score | High – requires device-specific optimizations | Medium to High – testing across devices and networks | Enhanced mobile user experience and rankings | Mobile-first websites and apps | Mobile-focused, comprehensive mobile UX |
| Server Response Time | Moderate to High – involves backend optimizations | Medium to High – may need infrastructure improvements | Reduced latency, foundation for overall speed | Backend/server performance improvement | Clear backend performance indicator |
| Conversion Rate | Low to Moderate – depends on tracking and performance work | Low to Medium – ROI-focused optimizations | Increased goal completions, revenue growth | E-commerce and business-critical sites | Direct business value measurement |
| Uptime/Availability | High – requires infrastructure redundancy and monitoring | High – often requires investment in failover systems | Reliable site access, user trust | Critical services, high-availability sites | Fundamental reliability metric |
Partnering with OneNine for Peak Performance
Mastering website performance indicators is crucial for online success. From Core Web Vitals and page load time to conversion rates and uptime, each metric discussed in this article plays a vital role in shaping user experience and driving business growth. By understanding and optimizing these website performance indicators, you can significantly improve your search engine rankings, attract more visitors, and ultimately boost your bottom line. The key takeaway is that a well-performing website translates to a thriving business.
To recap, prioritizing metrics like Time to First Byte (TTFB), bounce rate, mobile performance score, and server response time empowers you to identify bottlenecks and implement effective solutions. Remember, a fast, reliable, and engaging website is no longer a luxury but a necessity in today's competitive digital landscape.
Don't let technical complexities hinder your website's potential. OneNine specializes in optimizing website performance indicators, helping businesses like yours achieve peak performance. We'll work with you to implement the strategies discussed here, from improving Core Web Vitals to minimizing bounce rate. Visit OneNine today for a consultation and unlock your website’s true potential.


